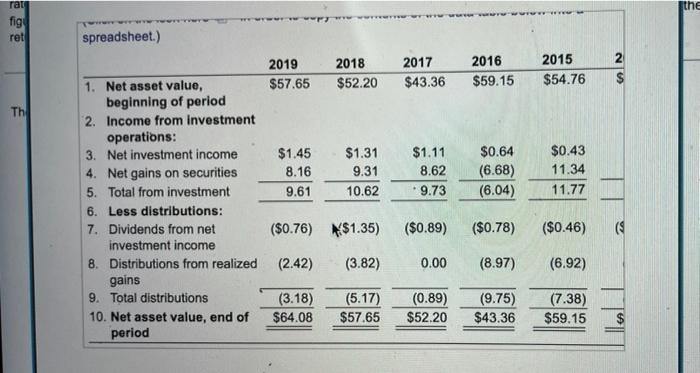
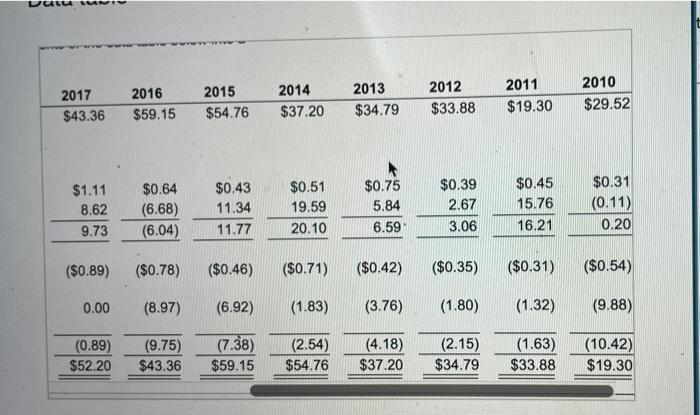
Listed here is the 10-year, per-share performance record of Blue Chip Growth Fund, as obtained from the fund" May 30, 2019, prospectus. Use this information to find the holding period return in 2019 and 2016. Also find the fund's rate of return over the 5-year period 2015-2019, and the 10-year period 2010-2019. Finally, rework the four return figures, assuming the fund has a front-end load charge of 2% (of NAV), Comment on the impact of load charges on th return behavior of mutual funds. The holding period return for 2019 is %. (Round to two decimal places.) the rat fig ret spreadsheet.) 2 2019 $57.65 2018 $52.20 2017 $43.36 2016 $59.15 2015 $54.76 AN $ Th $1.45 8.16 9.61 $1.31 9.31 10.62 $1.11 8.62 9.73 $0.64 (6.68) (6.04) $0.43 11.34 11.77 1. Net asset value, beginning of period 2. Income from investment operations: 3. Net investment income 4. Net gains on securities 5. Total from investment 6. Less distributions: 7. Dividends from net investment income 8. Distributions from realized gains 9. Total distributions 10. Net asset value, end of period ($0.76) $1.35) ($0.89) ($0.78) ($0.46) ( (2.42) (3.82) 0.00 (8.97) (6.92) (3.18) $64.08 (5.17) $57.65 (0.89) $52.20 (9.75) $43.36 (7.38) $59.15 2017 $43.36 2016 $59.15 2015 $54.76 2014 $37.20 2013 $34.79 2012 $33.88 2011 $19.30 2010 $29.52 $1.11 8.62 9.73 $0.64 (6.68) (6.04) $0.43 11.34 11.77 $0.51 19.59 20.10 $0.75 5.84 6.59 $0.39 2.67 3.06 $0.45 15.76 16.21 $0.31 (0.11) 0.20 ($0.89) ($0.78) ($0.46) ($0.71) ($0.42) ($0.35) ($0.31) ($0.54) 0.00 (8.97) (6.92) (1.83) (3.76) (1.80) (1.32) (9.88) (0.89) $52.20 (9.75) $43.36 (7.38) $59.15 (2.54) $54.76 (4.18) $37.20 (2.15) $34.79 (1.63) $33.88 (10.42) $19.30 Listed here is the 10-year, per-share performance record of Blue Chip Growth Fund, as obtained from the fund" May 30, 2019, prospectus. Use this information to find the holding period return in 2019 and 2016. Also find the fund's rate of return over the 5-year period 2015-2019, and the 10-year period 2010-2019. Finally, rework the four return figures, assuming the fund has a front-end load charge of 2% (of NAV), Comment on the impact of load charges on th return behavior of mutual funds. The holding period return for 2019 is %. (Round to two decimal places.) the rat fig ret spreadsheet.) 2 2019 $57.65 2018 $52.20 2017 $43.36 2016 $59.15 2015 $54.76 AN $ Th $1.45 8.16 9.61 $1.31 9.31 10.62 $1.11 8.62 9.73 $0.64 (6.68) (6.04) $0.43 11.34 11.77 1. Net asset value, beginning of period 2. Income from investment operations: 3. Net investment income 4. Net gains on securities 5. Total from investment 6. Less distributions: 7. Dividends from net investment income 8. Distributions from realized gains 9. Total distributions 10. Net asset value, end of period ($0.76) $1.35) ($0.89) ($0.78) ($0.46) ( (2.42) (3.82) 0.00 (8.97) (6.92) (3.18) $64.08 (5.17) $57.65 (0.89) $52.20 (9.75) $43.36 (7.38) $59.15 2017 $43.36 2016 $59.15 2015 $54.76 2014 $37.20 2013 $34.79 2012 $33.88 2011 $19.30 2010 $29.52 $1.11 8.62 9.73 $0.64 (6.68) (6.04) $0.43 11.34 11.77 $0.51 19.59 20.10 $0.75 5.84 6.59 $0.39 2.67 3.06 $0.45 15.76 16.21 $0.31 (0.11) 0.20 ($0.89) ($0.78) ($0.46) ($0.71) ($0.42) ($0.35) ($0.31) ($0.54) 0.00 (8.97) (6.92) (1.83) (3.76) (1.80) (1.32) (9.88) (0.89) $52.20 (9.75) $43.36 (7.38) $59.15 (2.54) $54.76 (4.18) $37.20 (2.15) $34.79 (1.63) $33.88 (10.42) $19.30


