Answered step by step
Verified Expert Solution
Question
1 Approved Answer
() Listen As part of a campus transit initiative, you have completed a Survey to identify groups of students and staff that identified their PRIMARY
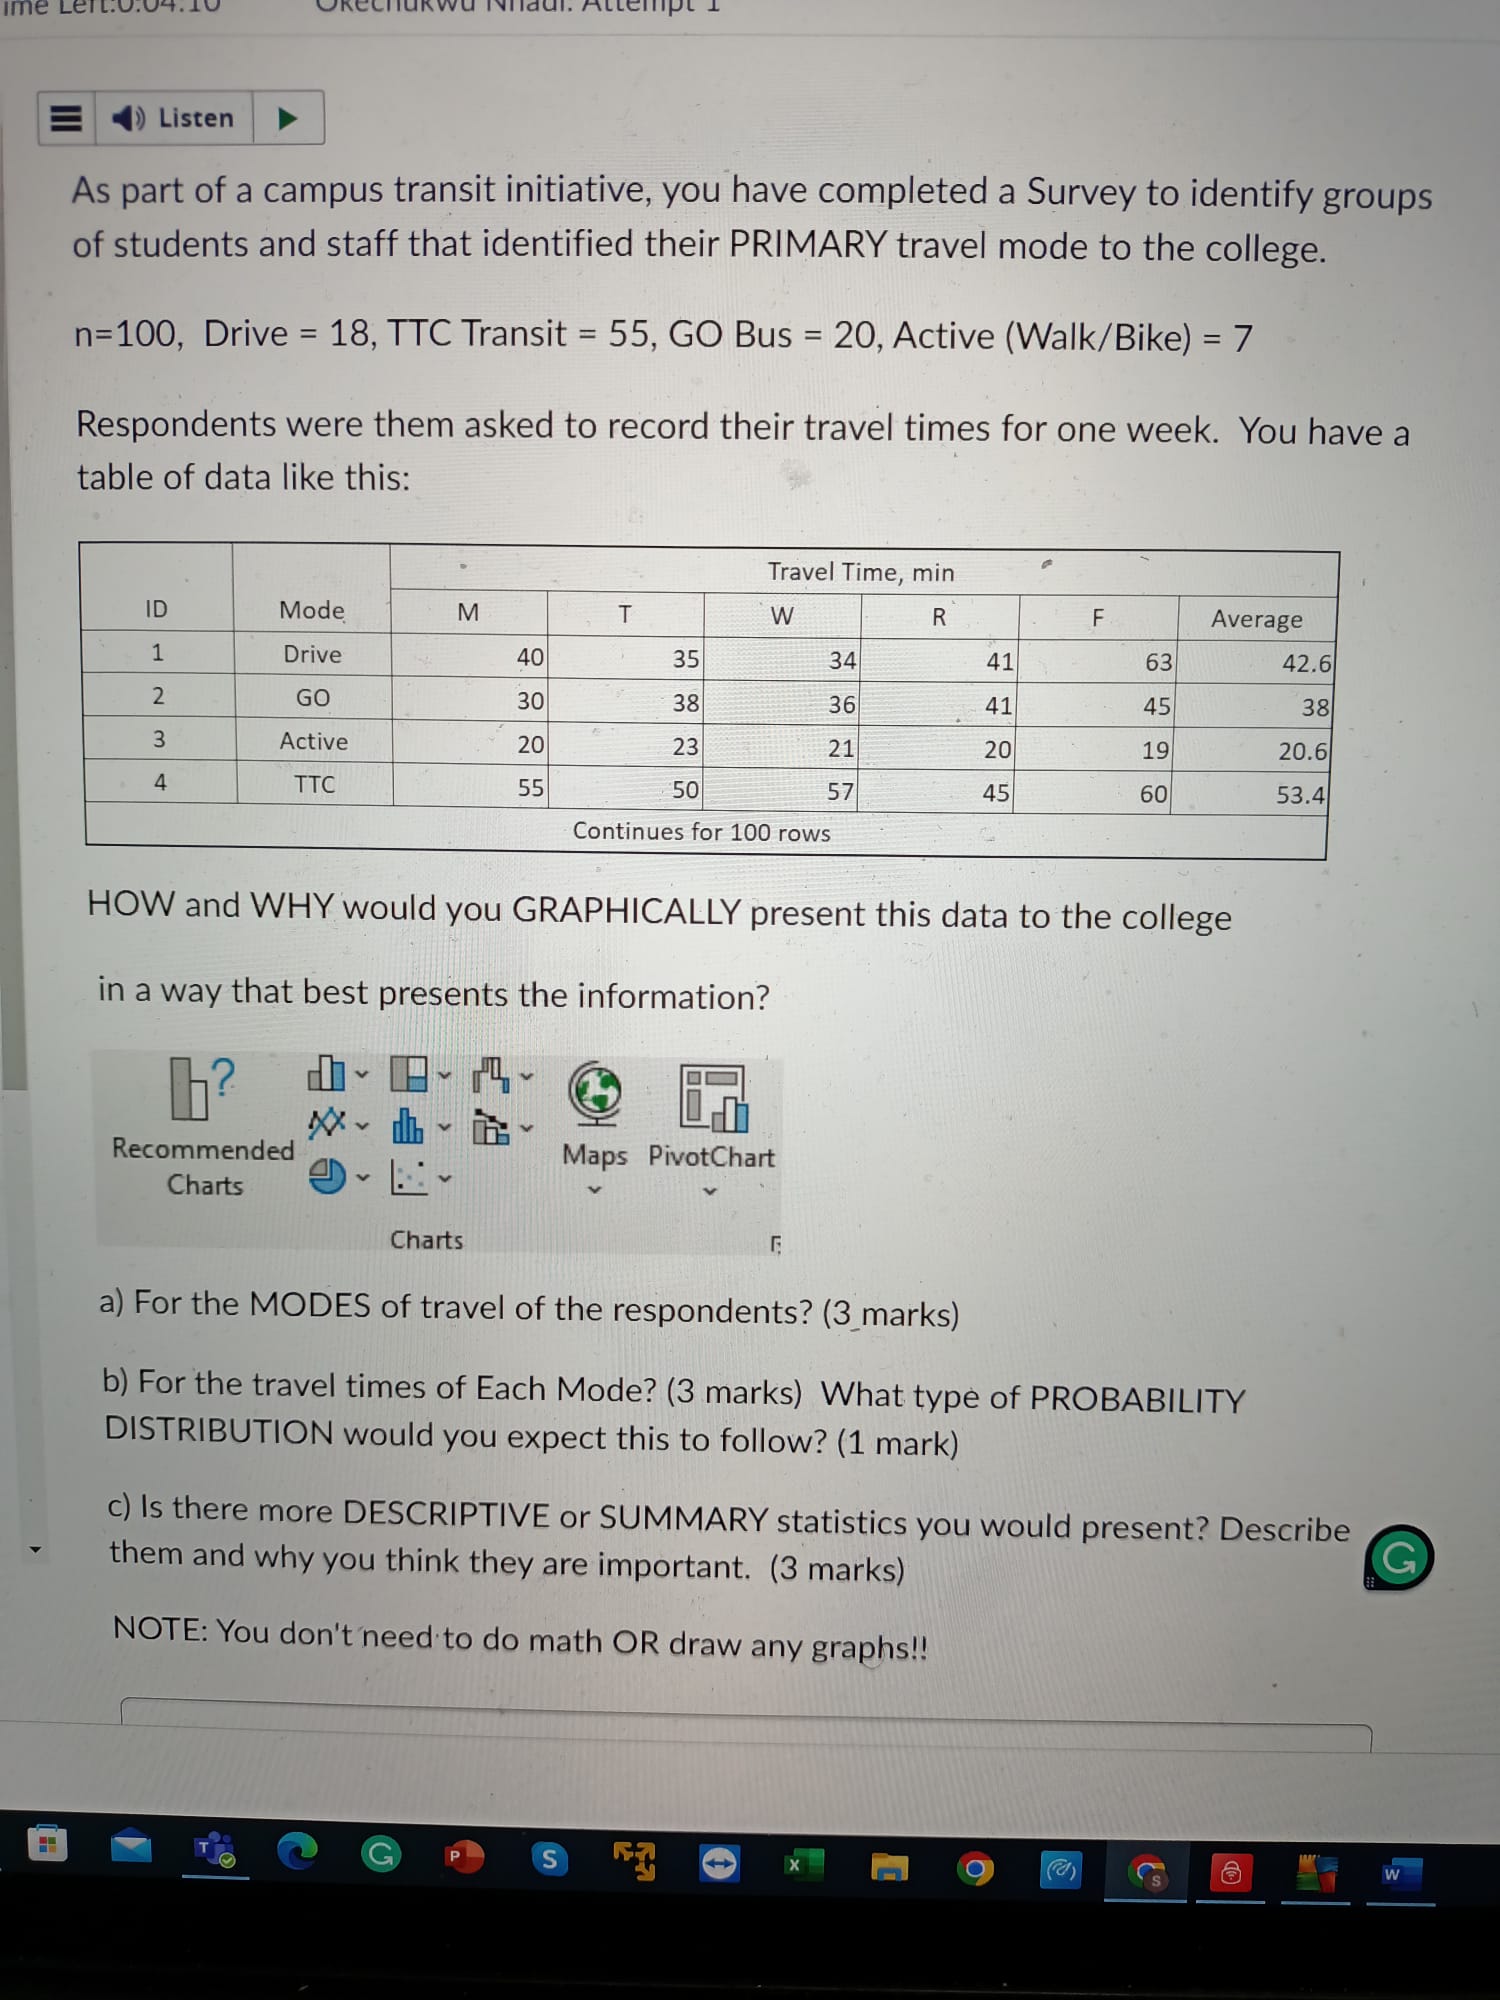
() Listen As part of a campus transit initiative, you have completed a Survey to identify groups of students and staff that identified their PRIMARY travel mode to the college. n=100, Drive = 18, TTC Transit = 55, GO Bus = 20, Active (Walk/Bike) = 7 Respondents were them asked to record their travel times for one week. You have a table of data like this: Travel Time, min ID Mode M T W R F Average 1 Drive 40 35 34 41 63 42.6 2 GO 30 38 36 41 45 38 3 Active 20 23 21 20 19 20.6 4 TTC 55 50 57 45 60 53.4 Continues for 100 rows HOW and WHY would you GRAPHICALLY present this data to the college in a way that best presents the information? Recommended Maps PivotChart Charts Charts a) For the MODES of travel of the respondents? (3 marks) b) For the travel times of Each Mode? (3 marks) What type of PROBABILITY DISTRIBUTION would you expect this to follow? (1 mark) c) Is there more DESCRIPTIVE or SUMMARY statistics you would present? Describe them and why you think they are important. (3 marks) NOTE: You don't need to do math OR draw any graphs! G P S X Is w
Step by Step Solution
There are 3 Steps involved in it
Step: 1
Get Instant Access to Expert-Tailored Solutions
See step-by-step solutions with expert insights and AI powered tools for academic success
Step: 2
Step: 3
Ace Your Homework with AI
Get the answers you need in no time with our AI-driven, step-by-step assistance
Get Started