Answered step by step
Verified Expert Solution
Question
1 Approved Answer
Liz Raiborn Inc. has the following financial results for the years 2019 through 2021 for its three regional divisions: 2019 2020 2021 $ 14,725 6,525
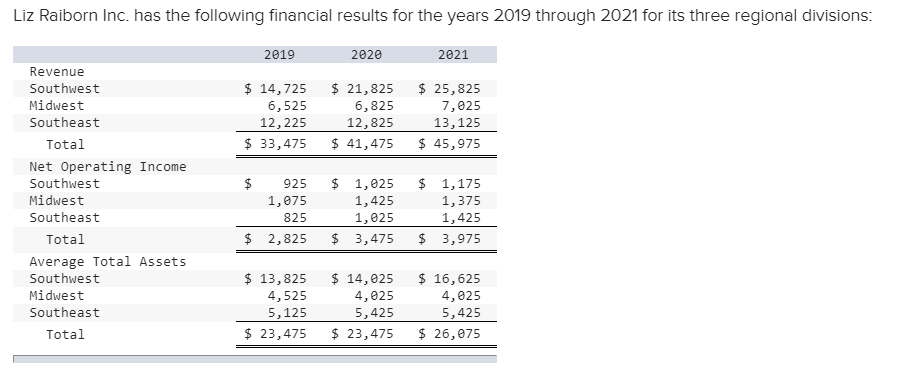
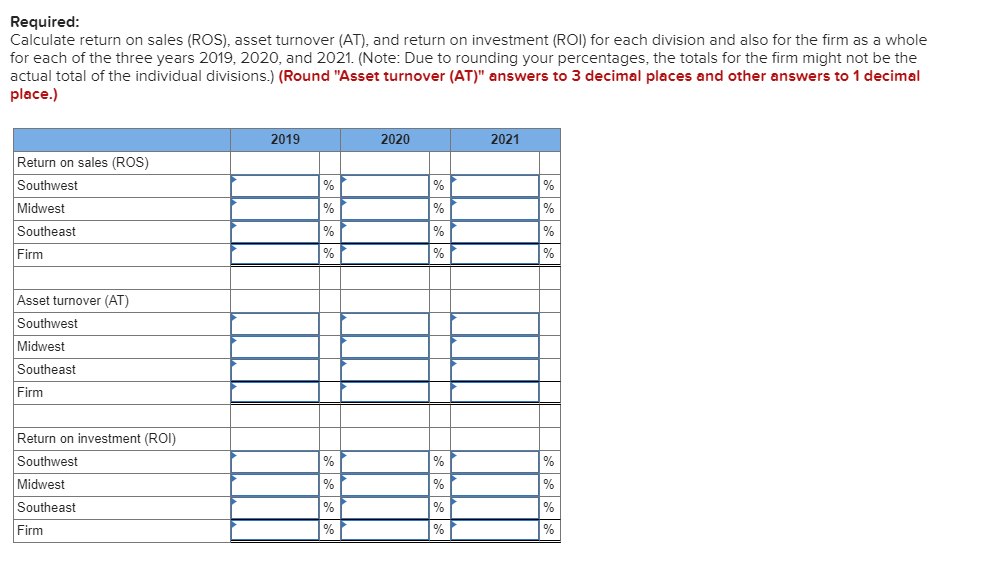
Liz Raiborn Inc. has the following financial results for the years 2019 through 2021 for its three regional divisions: 2019 2020 2021 $ 14,725 6,525 12,225 $ 33,475 $ 21,825 6,825 12,825 $ 41,475 $ 25,825 7,025 13,125 $ 45,975 $ $ $ Revenue Southwest Midwest Southeast Total Net Operating Income Southwest Midwest Southeast Total Average Total Assets Southwest Midwest Southeast Total 925 1,075 825 2,825 1,625 1,425 1,025 3,475 1,175 1,375 1,425 3,975 $ $ $ $ 13,825 4,525 5,125 $ 23,475 $ 14,025 $ 16,625 4,0254 ,025 5,4255 ,425 $ 23,475 $ 26,075 Required: Calculate return on sales (ROS), asset turnover (AT), and return on investment (ROI) for each division and also for the firm as a whole for each of the three years 2019, 2020, and 2021. (Note: Due to rounding your percentages, the totals for the firm might not be the actual total of the individual divisions.) (Round "Asset turnover (AT)" answers to 3 decimal places and other answers to 1 decimal place.) 2019 2020 2021 Return on sales (ROS) Southwest Midwest Southeast Firm Asset turnover (AT) Southwest Midwest Southeast Firm Return on investment (ROI) Southwest Midwest Southeast Firm
Step by Step Solution
There are 3 Steps involved in it
Step: 1
Get Instant Access to Expert-Tailored Solutions
See step-by-step solutions with expert insights and AI powered tools for academic success
Step: 2
Step: 3
Ace Your Homework with AI
Get the answers you need in no time with our AI-driven, step-by-step assistance
Get Started