Answered step by step
Verified Expert Solution
Link Copied!

Question

1 Approved Answer

ll small business istrying to determine the effect of a social media marketing campaign on sales. The plot below shows the relationship between the social
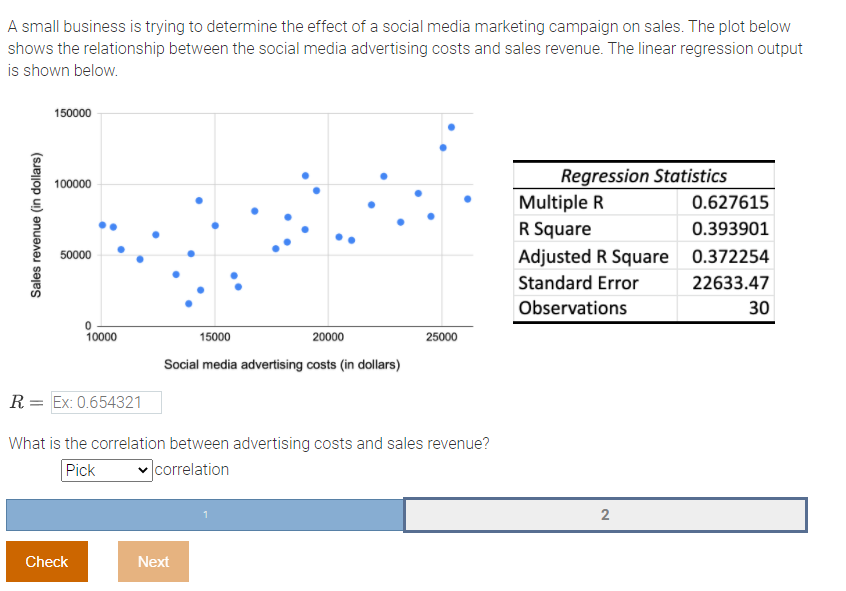
image text in transcribed
ll small business istrying to determine the effect of a social media marketing campaign on sales. The plot below shows the relationship between the social media advertising costs and sales revenue. The linear regression output is shown below. 131!\" . ___ . g ,m o i a . Regression Statistics g - _ . . ' Multiple :2 0.527615 . g I o _ I! . o 1. - " R Square 0.393901 5 ma ' . - ' Adjusted R Square 0.322254 :1; ' . '. Standard Error 22633.4? "' Observations 30 2m 15\"\" m 25\" Sadat madi. advarliaim can: {in dun-a) R = Ex: [3.654321 What is the correlation between advertising costs and sales revenue? Pick v correlation -m

Step by Step Solution

There are 3 Steps involved in it

Step: 1

blur-text-image

Get Instant Access to Expert-Tailored Solutions

See step-by-step solutions with expert insights and AI powered tools for academic success

Step: 2

blur-text-image_2

Step: 3

blur-text-image_3

Ace Your Homework with AI

Get the answers you need in no time with our AI-driven, step-by-step assistance

Get Started

Recommended Textbook for

Advanced Engineering Mathematics

Authors: ERWIN KREYSZIG

9th Edition

0471488852, 978-0471488859

More Books

Students also viewed these Mathematics questions

Question

Seminars begin at 9 A.M. and wrap up at 4:00 P.M.

Answered: 1 week ago