Answered step by step
Verified Expert Solution
Question
1 Approved Answer
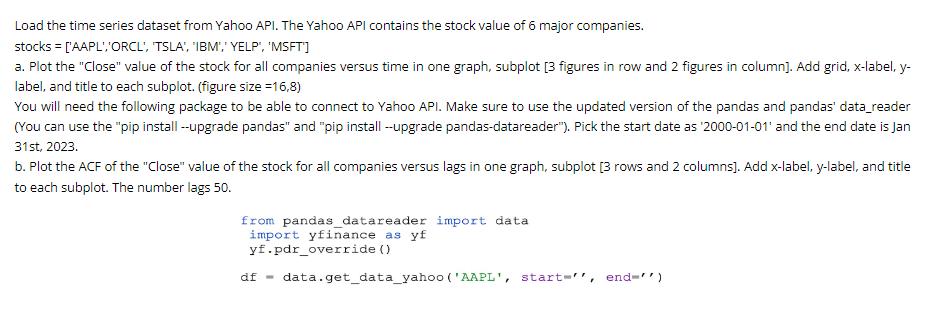
Load the time series dataset from Yahoo API. The Yahoo API contains the stock value of 6 major companies. stocks = ['AAPL', 'ORCL', TSLA',

Load the time series dataset from Yahoo API. The Yahoo API contains the stock value of 6 major companies. stocks = ['AAPL', 'ORCL', TSLA'", "IBM",' YELP', 'MSFT'] a. Plot the "Close" value of the stock for all companies versus time in one graph, subplot [3 figures in row and 2 figures in column]. Add grid, x-label, y- label, and title to each subplot. (figure size=16,8) You will need the following package to be able to connect to Yahoo API. Make sure to use the updated version of the pandas and pandas' data_reader (You can use the "pip install --upgrade pandas" and "pip install --upgrade pandas-datareader"). Pick the start date as '2000-01-01' and the end date is Jan 31st, 2023. b. Plot the ACF of the "Close" value of the stock for all companies versus lags in one graph, subplot [3 rows and 2 columns]. Add x-label, y-label, and title to each subplot. The number lags 50. from pandas_datareader import data import yfinance as yf yf.pdr_override () df - data.get_data_yahoo ('AAPL', start end-)
Step by Step Solution
★★★★★
3.49 Rating (156 Votes )
There are 3 Steps involved in it
Step: 1
python from pandasdatareader import data import yfinance as yf yfpdroverride start 20000101 end 20230131 stocks AAPL ORCL TSLA IBM YELP MSFT for stock in stocks df datagetdatastock startstart endend P...
Get Instant Access to Expert-Tailored Solutions
See step-by-step solutions with expert insights and AI powered tools for academic success
Step: 2

Step: 3

Ace Your Homework with AI
Get the answers you need in no time with our AI-driven, step-by-step assistance
Get Started


