Answered step by step
Verified Expert Solution
Link Copied!

Question

1 Approved Answer

Long Answer (45 points) Question 9 Obs. #: Team. Wins Avg. Shots Against 1 1 Toronto Y1 = 54 X1 = 29.19 Minnesota Y2 =
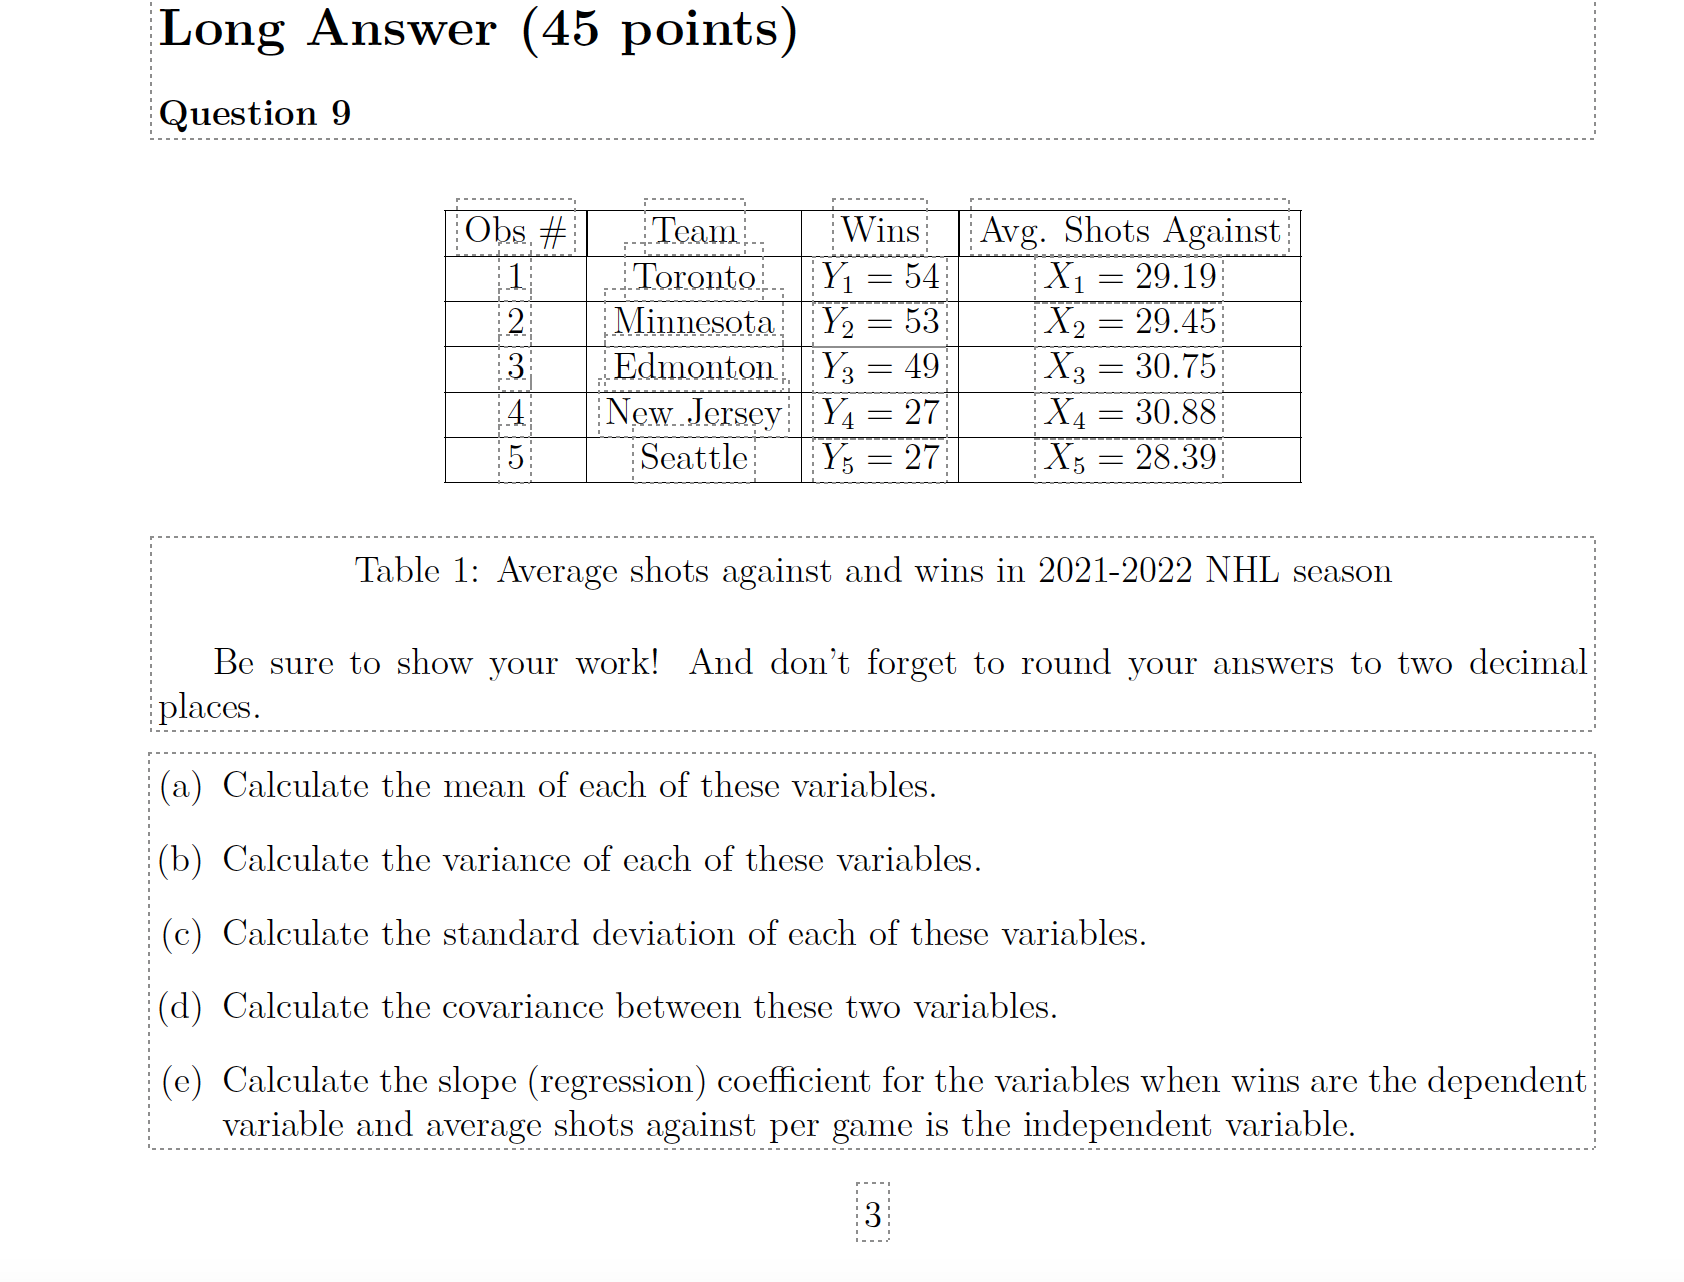
image text in transcribed
Long Answer (45 points) Question 9 Obs. #: Team. Wins Avg. Shots Against 1 1 Toronto Y1 = 54 X1 = 29.19 Minnesota Y2 = 53 X2 = 29.45 Edmonton; Y3 = 49 X3 = 30.75 New Jersey YA = 27 X4 = 30.88 Seattle Y5 = 27 X5 = 28.39 Table 1: Average shots against and wins in 2021-2022 NHL season Be sure to show your work! And don't forget to round your answers to two decimal places. (a) Calculate the mean of each of these variables. (b) Calculate the variance of each of these variables. (c) Calculate the standard deviation of each of these variables. (d) Calculate the covariance between these two variables. (e) Calculate the slope (regression) coefficient for the variables when wins are the dependent variable and average shots against per game is the independent variable. 3

Step by Step Solution

There are 3 Steps involved in it

Step: 1

blur-text-image

Get Instant Access to Expert-Tailored Solutions

See step-by-step solutions with expert insights and AI powered tools for academic success

Step: 2

blur-text-image

Step: 3

blur-text-image

Ace Your Homework with AI

Get the answers you need in no time with our AI-driven, step-by-step assistance

Get Started

Recommended Textbook for

Probability and Stochastic Processes A Friendly Introduction for Electrical and Computer Engineers

Authors: Roy D. Yates, David J. Goodman

3rd edition

1118324560, 978-1118324561

More Books

Students also viewed these Mathematics questions

Question

Did not mean to post a question.

Answered: 1 week ago

Question

Q.1. Taxonomic classification of peafowl, Tiger and cow ?

Answered: 1 week ago

Question

Q .1. Different ways of testing the present adulterants ?

Answered: 1 week ago

Question

Q.1. Health issues caused by adulteration data ?

Answered: 1 week ago