Question
Short-Term decision making based on Costing. ____________________________________________ Lonton Water (A) It was 2011, and Lonton Water, the water system of the City of Lonton, Ontario
Short-Term decision making based on Costing.
____________________________________________
Lonton Water (A)
It was 2011, and Lonton Water, the water system of the City of Lonton, Ontario (the city, or Lonton), had run deficits in eight of the past nine years. There was significant pressure from many sides to pull Lonton Water out of the red. The Water Engineering Division`s manager, Roland Walter, P. Eng., knew that something needed to change. The idea of a revenue-rate structure overhaul was an attractive option; however, myriad political, economic, and environmental issues were at play. Moreover. Walter, as a steward of one of the city`s most important utilities, needed to find a solution that would work in both the short run and the long run.
Water history in the forest city
The history of Lonton, Ontario, dates back to 1793, when Ontario Lieutenant-Governor John Graves Simcoe selected the Thames River area as his choice for the future capital city of Ontario. The city was not officially founded until 1826, by which time, the provincial capital had already been established as Toronto. By 2011, Lonton `s population had reached 350,000 people.
Construction of Lonton`s water infrastructure began in the 1870s, as a way to provide safe and reliable drinking water – and fire protection. The first water regulatory statutes were passed in 1873 with the Lonton Waterworks Act.
As opposed to a general-taxation funding model, the water utility operated on the basis of full cost recovery and user-pay, both of which had been in place since the early 1900s.
Lonton `s modern-day municipal drinking water system was a complex network of treatment plants, reservoirs, pumping stations, and pipes. The water was sourced exclusively from the Great Lakes: approximately 85 percent of its treated water came from Lake Huron, and 15 percent from Lake Erie.
Lonton Water used a metering system to measure and charge for water usage. Whereas the cost for bottled water ranged between $0.28 and $8 per litre, City water cost, on average, less than $0.003 per litre.
Every residential, industrial, commercial, education, and government institution serviced by Lonton Water was equipped with a water meter to track consumption.
Up until 1993, the Lonton`s Public Utilities Commission (PUC) provided water, electricity and recreation services to Lonton residents and businesses. As part of an agreement for annexation, the PUC was dissolved in 1993, and the City took over operations of the water and recreation services, but remained as the sole shareholders of a new private electric company known as Lonton Hydro.
Due to economies of scale, Lonton Hydro remained the meter reading, billing, and customer service provider for Lonton`s water and wastewater services. Around 2003, in an effort to formalize the process, a service level agreement (SLA) was established between the city and Lonton Hydro to outline the services, accountabilities, and reporting requirements for the provision of the billing service.
As part of the service outlined in SLA, Lonton Hydro managed meter reading activities through an outside contractor, a third-party mailing contractor, a customer contact centre, and the billing software that was provided to the city to conduct meter maintenance.
Water safety regulations
Since 1968, Health Canada`s Federal-Provincial-Territorial Committee on Drinking Water had been publishing Guidelines for Canadian Drinking Water Quality and the supporting Guideline Technical Documents.
Following the Walkerton water contamination disaster in 2000 that killed seven people, Ontario passed several regulations as part of its Safe Drinking Water Act in 2002.
Included in subsequent, related legislation was a series of financial requirements, including the need for water utilities to become sustainable in the near term and remain sustainable in the long term – that is, the utilities revenues needed to cover their costs.
Lonton Water had a strong water quality safety record and was dedicated to meeting all regulatory standards. It performed more than 12,000 water quality tests annually to assess for 137 organic, inorganic, microbiological and chemical components. But it was not operating in the black.
Rate structure and cost behavior
Lonton Water represented three business units/utilities within the city, which operate as a not-for-profit business:
1) water supply,
2) wastewater collection and treatment and
3) stormwater management.
Many variables influenced the way the city structured the rates. It was decided that the three utilities would merge to eliminate inconsistencies in customer classification.
From a cost perspective, the water itself was inexpensive. For a nominal rate, the city purchased large amounts of bulk water from the Great Lakes via the Lake Huron and Elgin Area Water Supply Systems.
The infrastructure to supply the water and remove the wastewater, however, was substantial, complex and costly. The combined replacement value of the three utilities was more than $6.5 billion, most of which represented the pipes buried in the ground. While some pipes in Lonton were more than 100 years old, the North American average life expectancy of pipes was 75 years. Lonton Water had experienced pipe life as short as 20 years for some materials. Lonton Water needed to collect fees beyond the costs of water in order to cover infrastructure replacements and upgrades.
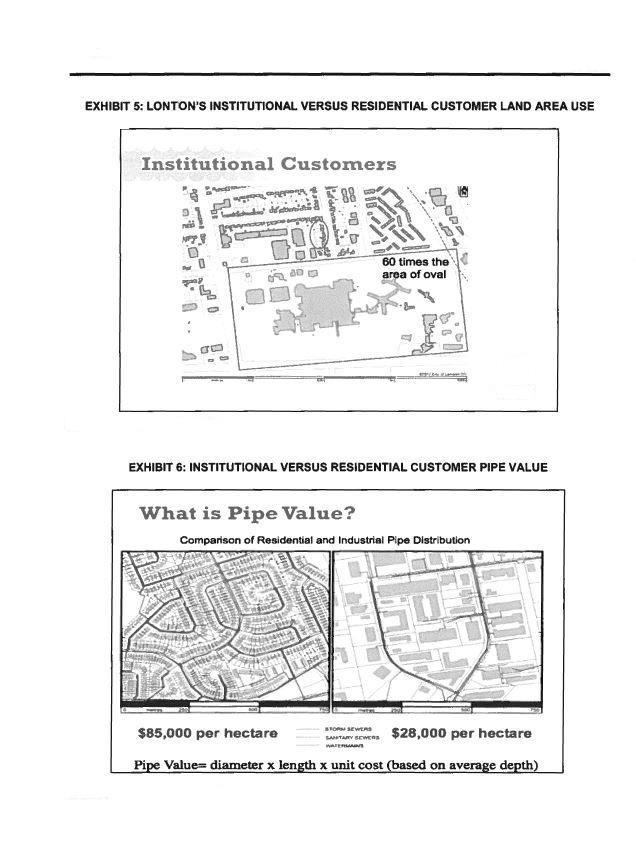
An issue of fairness arose, specifically whether the water bill should reflect the amount of water individuals used in their home or business, the amount of infrastructure required for delivering the water or some combination of both. And many disparities existed within the delivery versus the costing of water and its sub-services. For example, although residential piping was denser than industrial/institutional piping, in terms of wastewater services, large customers were not paying enough for the required infrastructure cost. Similarly, in regards to stormwater services, large institutional customers had disproportionate stormwater runoff requirements, using significant storm system capacity. As an example, one institutional customer occupied 60 times the overall area of eight family residences, yet those residential customers paid more than the institutional customer for stormwater. In essence, residential customers were subsidizing institutional customers. Lonton Water was considering advocating that consumers accept a system whereby all customers covered the cost of the pipes, regardless of the amount of their water usage. Water usage would then be charged in addition to the infrastructure charge, but at lower rate than the existing rate. Put another way, Lonton Water believed that the user-pay model and full-cost pricing continued to be the best methods to run its water business.
Moreover, the city had the modus operandi to reduce water usage, both to avoid costly infrastructure expansion and to address environmental concerns of water waste. Increasing rates were likely to decrease water usage.
But higher rates were also likely to be unpopular with the public and to create a backlash against city officials and elected municipal politicians. Any change would involve major public and stakeholder considerations.
Additionally, increased water rates could negatively affect the city`s attractiveness to commercial and industrial companies that had high water usage. Southwestern Ontario`s economy – Lonton included – was highly dependent on manufacturing. As one example, the original Labatt Brewery continued to produce more than one billion bottles of beer annually, making it a major water user in Lonton – and an important economic asset to the city.
Walter was in a sticky situation. A rate increase could reduce individual use of water waster, but at the same time, could make Lonton a less attractive location for industry. An equally challenging dilemma was determining a rate structure that would ensure the current generation paid its fair share and did not burden future generations with either significant debt or failing utilities.
Stewardship
A rate structure change was definitely on the table. But it would be a big change. Not only would there be a backlash vis-à-vis many of the already mentioned issues but Lonton Water would be differentiated from many of the water divisions in the rest of the province, most of which used a uniform-rate structure.
Walter, however, had more on his plate than whether or not to change the rate structure. Whatever path he chose to balance Lonton Water`s books needed to fit into the larger, long-term plan. Lonton Water planned 50 to 100 years into the future. Walter commented:
Change is a thing that drives customers crazy. At the end of the day there is no right answer and there are different approaches to solving the problem. Other municipalities may have lower rates. Well, why is that? Perhaps that`s because they haven`t recognized that they are so far behind, and that is true with many of the smaller municipalities. The larger municipalities generally speaking have been proactive thinking ahead, seeing the problem in the future, and improving the revenue stream.
Long-term strategic planning for 100 years was difficult, especially when the city council terms were four years. Walter already knew the city had a water main from the 1950s and 1960s that would need to be completely replaced in the next 25 years. There was some hope in the industry that, given innovation in technology and construction techniques, the current, typical pipe lifetime projections could move from 100 to 150 years. But such innovations could not be relied on for planning purposes.
The longer out the plan, the less clarity. In the words of Walter:
A 100-year plan is really clear over the next five years, the next 10 years is pretty good, a little fuzzy over the following 20, and 75 years and beyond is a guess. The long-term outlook is done with a sensitivity analysis… As long as the water meters keep turning, life is good. That`s our cash register.


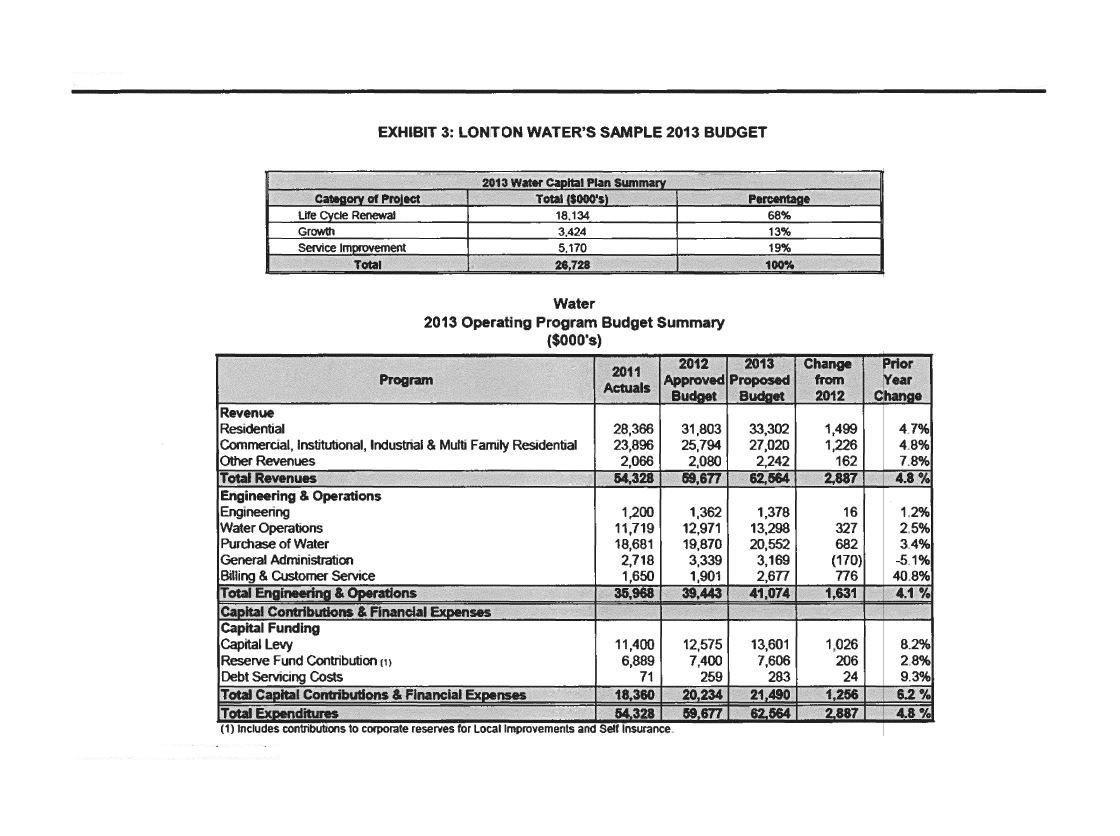
Category of Project EXHIBIT 3: LONTON WATER'S SAMPLE 2013 BUDGET Life Cycle Renewal Growth Service Improvement Total Other Revenues Total Revenues Water Operations Purchase of Water General Administration Program Engineering & Operations Engineering Revenue Residential Commercial, Institutional, Industrial & Multi Family Residential 2013 Water Capital Plan Summary Total ($000's) Billing & Customer Service Total Engineering & Operations Water 2013 Operating Program Budget Summary ($000's) 18,134 3,424 5,170 26,728 Capital Contributions & Financial Expenses Capital Funding Capital Levy Reserve Fund Contribution (1) 2011 Actuals 11,400 6,889 71 28,366 31,803 33,302 1,499 23,896 25,794 27,020 1,226 2,066 2,080 2,242 54,328 69,677 62,564 162 2,887 Percentage 68% 2012 2013 Approved Proposed Change from Budget Budget 2012 1,200 1,362 1,378 11,719 12,971 13,298 18,681 19,870 20,552 2,718 3,339 3,169 1,650 1,901 2,677 35,968 39,443 41,074 Debt Servicing Costs Total Capital Contributions & Financial Expenses Total Expenditures (1) Includes contributions to corporate reserves for Local Improvements and Self Insurance 18,360 54,328 13% 19% 100% 259 12,575 13,601 7,400 7,606 283 21,490 20,234 59,677 62,564 16 327 682 (170) 776 1,631 1,026 206 24 1,256 2,887 Prior Year Change 4.7% 4.8% 7.8% 4.8 % 1.2% 2.5% 3.4% -5.1% 40.8% 4.1% 8.2% 2.8% 9.3% 6,2% 4.8% Category of Project EXHIBIT 3: LONTON WATER'S SAMPLE 2013 BUDGET Life Cycle Renewal Growth Service Improvement Total Other Revenues Total Revenues Water Operations Purchase of Water General Administration Program Engineering & Operations Engineering Revenue Residential Commercial, Institutional, Industrial & Multi Family Residential 2013 Water Capital Plan Summary Total ($000's) Billing & Customer Service Total Engineering & Operations Water 2013 Operating Program Budget Summary ($000's) 18,134 3,424 5,170 26,728 Capital Contributions & Financial Expenses Capital Funding Capital Levy Reserve Fund Contribution (1) 2011 Actuals 11,400 6,889 71 28,366 31,803 33,302 1,499 23,896 25,794 27,020 1,226 2,066 2,080 2,242 54,328 69,677 62,564 162 2,887 Percentage 68% 2012 2013 Approved Proposed Change from Budget Budget 2012 1,200 1,362 1,378 11,719 12,971 13,298 18,681 19,870 20,552 2,718 3,339 3,169 1,650 1,901 2,677 35,968 39,443 41,074 Debt Servicing Costs Total Capital Contributions & Financial Expenses Total Expenditures (1) Includes contributions to corporate reserves for Local Improvements and Self Insurance 18,360 54,328 13% 19% 100% 259 12,575 13,601 7,400 7,606 283 21,490 20,234 59,677 62,564 16 327 682 (170) 776 1,631 1,026 206 24 1,256 2,887 Prior Year Change 4.7% 4.8% 7.8% 4.8 % 1.2% 2.5% 3.4% -5.1% 40.8% 4.1% 8.2% 2.8% 9.3% 6,2% 4.8%
Step by Step Solution
3.45 Rating (152 Votes )
There are 3 Steps involved in it
Step: 1
In order to make a shortterm decision based on costing Lonton Water must consider a number of factors that are relevant to their situation Firstly they must consider the cost of their infrastructure a...
Get Instant Access to Expert-Tailored Solutions
See step-by-step solutions with expert insights and AI powered tools for academic success
Step: 2

Step: 3

Ace Your Homework with AI
Get the answers you need in no time with our AI-driven, step-by-step assistance
Get Started


