Look at charts and answer questions however you can
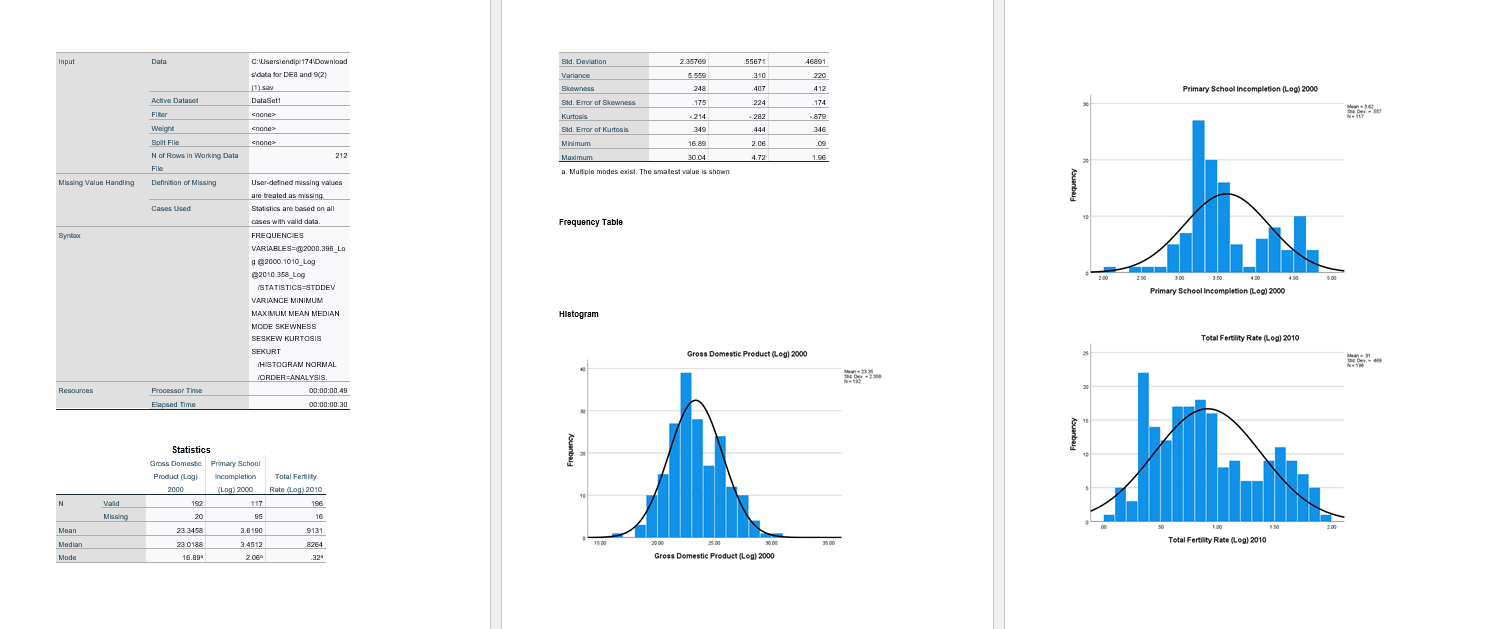
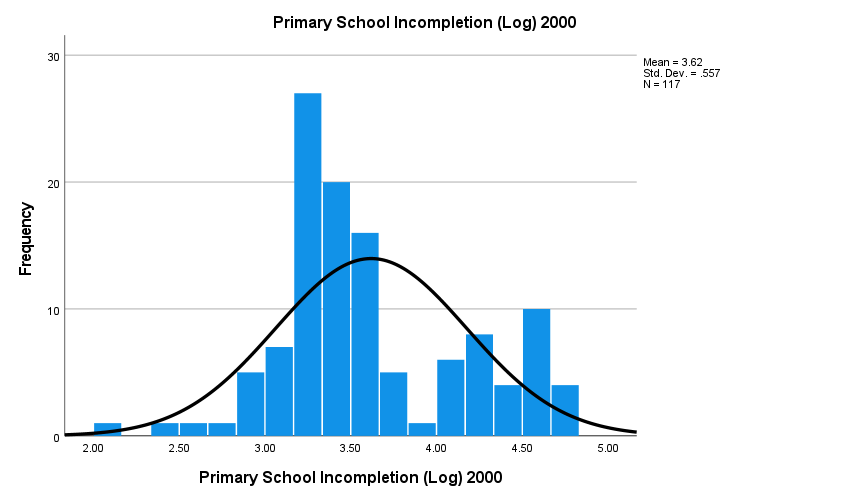
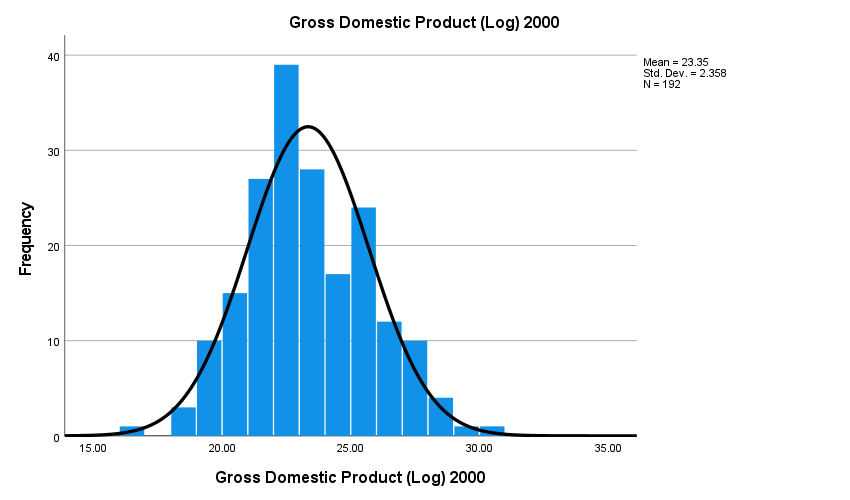
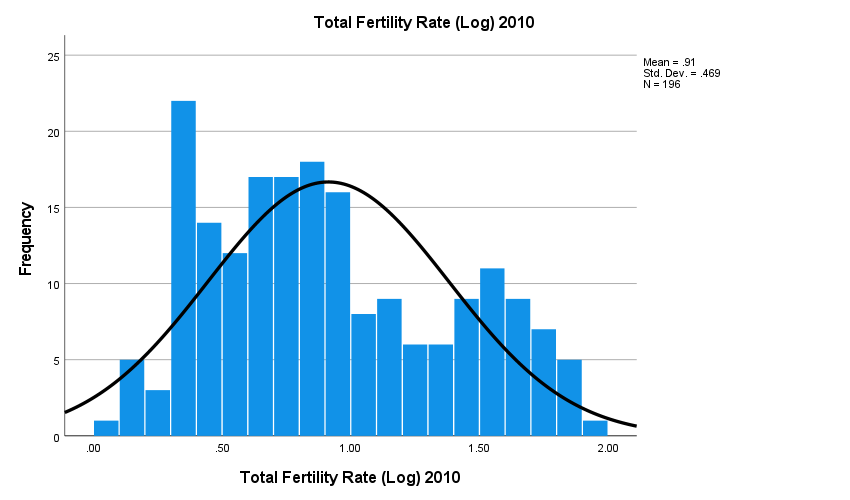
For this assignment we will be continuing our study of the relationship between female education, Gross Domestic Product, and the total fertility rates for different countries. Demographers?population scientists?wish to understand why some nations have higher rates of fertility than others. We will examine economic and cultural causes with this analysis. This time, we will examine them as regressions. We will then run a multiple regression model to see which variable has the most predictive power, net of the other variable.
1. Begin your report with an overview of the analysis: what are the goals of the study? What are the relevant variables, and how will you be analyzing them?
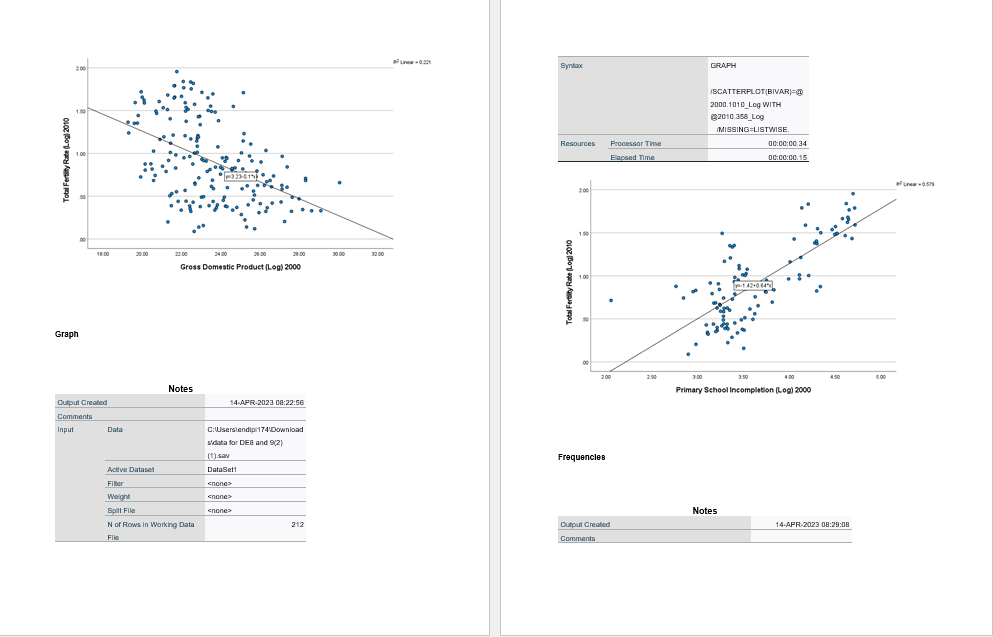
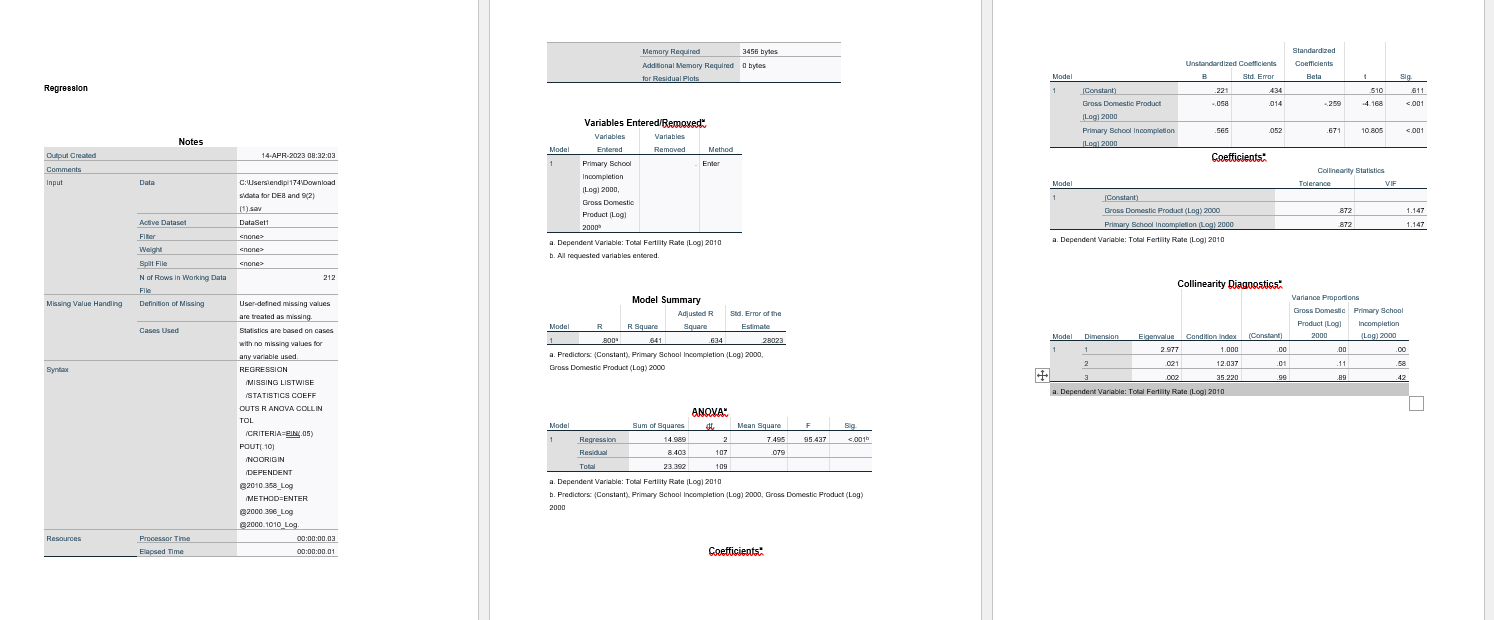
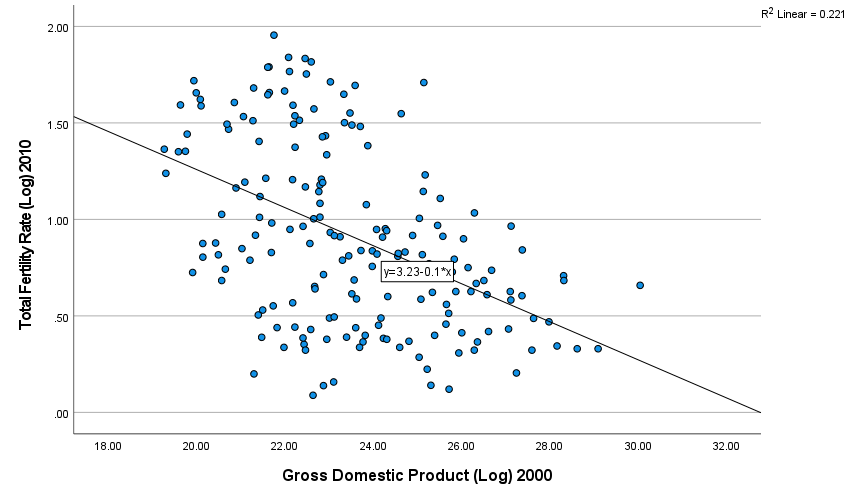
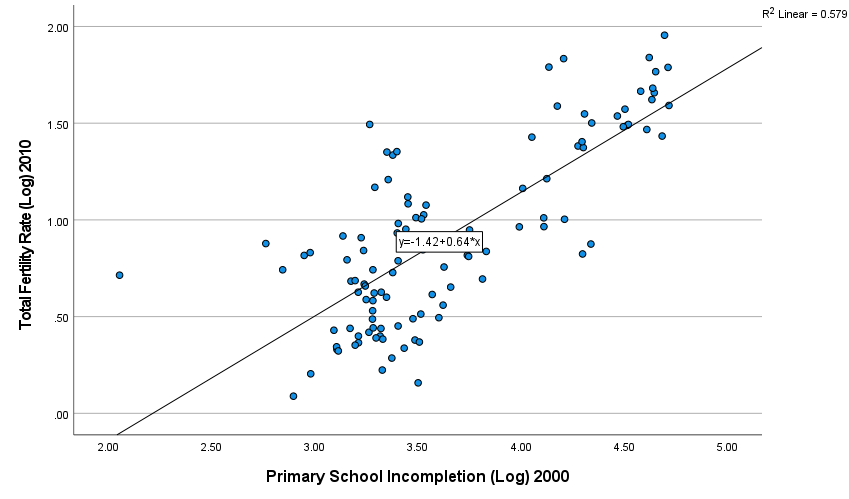
2. Describe the first part examine the regression scatterplots. What are the levels of association? What is the equation for each? Are they statistically significant? Next, interpret the multiple regression analysis.
3. Which variable seemed to be the better predictor of the total fertility rate? Base your answer on both parts of the analysis.
GRAPH SCATTERPLOT BIVARFO 2000.1010_Log WITH 20-10 358_Log MISSING=LISTWISE Resources Processor The 10:00:00.24 Elapsed Time 0 0:00:00.15 Total Fertility Rate (Log) 2010 24 00 30100 32010 Gross Domestic Product (Log) 2000 1.09 Total Fertility Rate (Log) 2010 Graph 200 3:50 Notes Primary School Incompletion (Logi 2000 Output Created 14-APR-2023 08:22:56 Comments Input Data C:Wsersiendip 174\\Download sidata for DEB and 9(2 Frequencies Active Dataset DataSet1 nonce Weight cnones Split File cnones Notes N of Flows In Working Data 212 Output Created 14-APR-2023 08:20:08 File Comments46891 C:Wserslendip 174\\Download Sid. Deviation 2 35769 65671 Input Data sidata for DEB and 9(2) Variance 5 559 .310 220 Brewness 248 407 412 Primary School Incompletion (Log) 2000 (1) sa Active Dataset DataSet1 Bid. Error of Skewness .175 .224 -174 nones Kurtosis -214 ..282 879 Weight Enones Bid. Error of Kurtoats 349 444 346 Spilt File nones Minimum 16 89 2.06 _09 N of Flows In Working Data 212 Mandmun 30 04 4.72 1.96 File a. Multiple modes exist. The smallest value is shown Frequency Missing Value Handling Definition of Missing User-defined missing values are treated as missing. Cases Used Statistics are based on all cases with valid data Frequency Table FREQUENCIES VARIABLES=@2000.396_Lo g @2000.1010_Log 2:50 1.50 4 DO 4.50 82010.358_Log /STATISTICS=STDDEV Primary School Incompletion (Lag) 2000 VARIANCE MINIMUM MAXIMUM MEAN MEDIAN Histogram MODE SKEWNESS Total Fertility Rate (Log) 2010 SESKEW KURTOSIS SEKURT Gross Domestic Product (Log) 2000 HISTOGRAM NORMAL ORDER=ANALYSIS. Resources Processor Time 00:00:00.49 Elapsed Time 00:00:00.30 Frequency Frequency Statistics Gross Domestic Primary School Product (Log) Incompletion Total Fertility 2000 (Log) 2000 Rate (Log) 2010 Vaild 192 117 Missing 20 16 Mean 23 3468 3.6190 9131 15.00 23.0188 20 00 25 90 Total Fertility Rate (Log) 2010 30.00 Median 3.4512 8264 2 060 Gross Domestic Product (Leg) 2000 Mode 16.89Memory Required 3456 bytes Standardized Additional Memory Required 0 bytes Unstandardized Coefficients Coefficients for Residual Plots Model Std. Emor Beta Regresalon [Constant) .221 434 510 611 Gross Domestic Product .058 D14 .259 .4.168 <.001 variables entered removers primary school incompletion notes log output created model removed method enter coefficients comments collinearity statistics input data c:wserslendip tolerance vif sidata for deb and gross domestic product active dataset dataset1 inc on fiber enones a. dependent variable: total fertility rate weigh enone . all requested entered. split file none n of flows in working diagnostics definition missing summary variance proportions value handling user-defined values adjusted r sid. error the are treated as missing. cases used based r. square estimate .634 dimension eigenvalue condition inde with no .0c any variable predictors: regression listwise .89 coeff outs anova collin tol sum squares mean c.001h pouti-10 residual ingorigin imethod="ENTER" b. ampletion froduct resources processor elapsed time linear="0.221" o ooo coo y="3.23-0.1*x" .50 .00 std. dev.="2.358" frequency>
