

Answered step by step
Verified Expert Solution
Question
1 Approved Answer
Look at the stock price chart (Figure 1, p.3) and provide an explanation for the pattern you see in the stock price. Figure 1. Stock
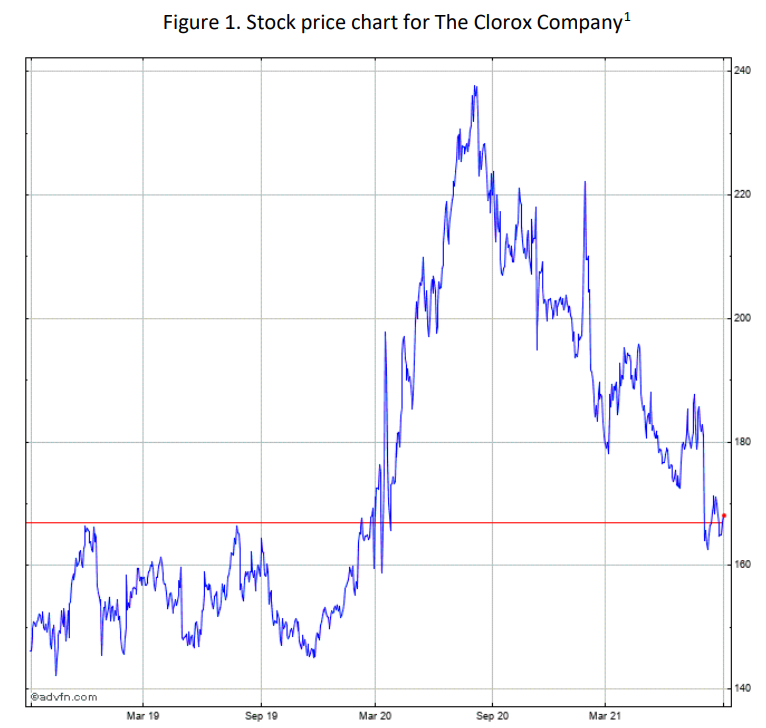
| Look at the stock price chart (Figure 1, p.3) and provide an explanation for the pattern you see in the stock price. | |||||
Step by Step Solution
There are 3 Steps involved in it
Step: 1

Get Instant Access to Expert-Tailored Solutions
See step-by-step solutions with expert insights and AI powered tools for academic success
Step: 2

Step: 3
Ace Your Homework with AI
Get the answers you need in no time with our AI-driven, step-by-step assistance
Get Started
The Complete Guide To Investing In Commodity Trading And Futures How To Earn High Rates Of Returns Safely
Authors: Mary P Holihan
1st Edition
1601380038, 978-1601380036