Looking at Handout 3, can you please explain how the solutions on Handout 4 were obtained?
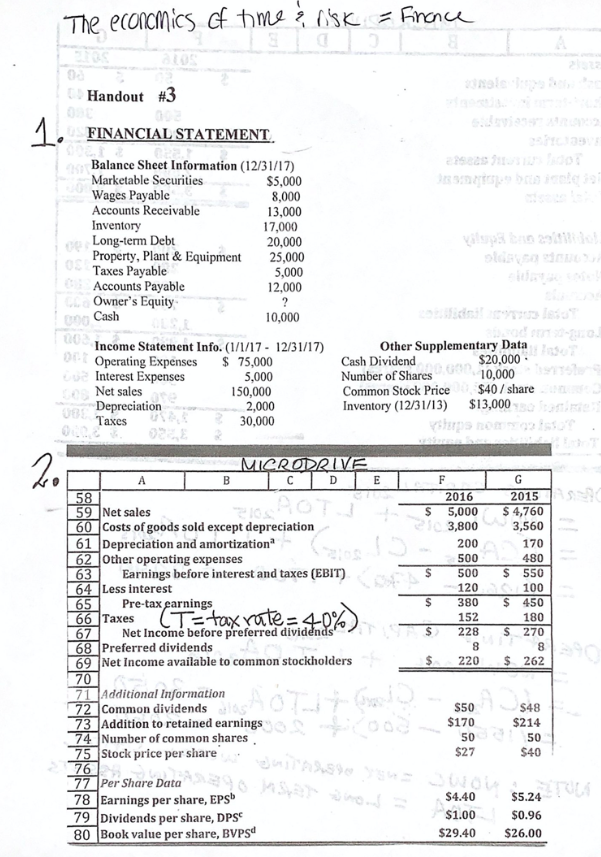
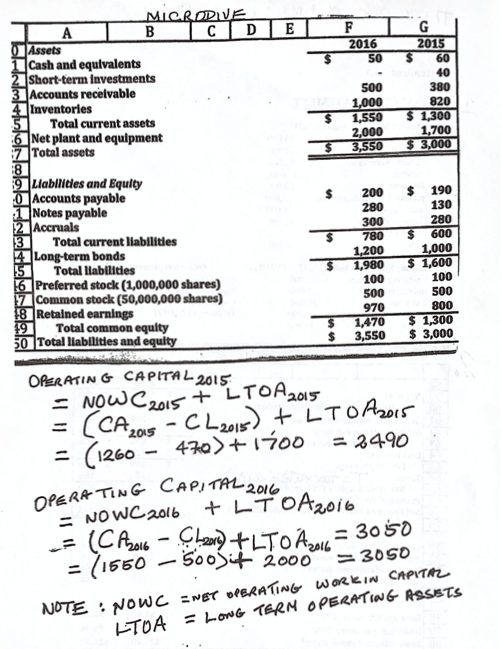
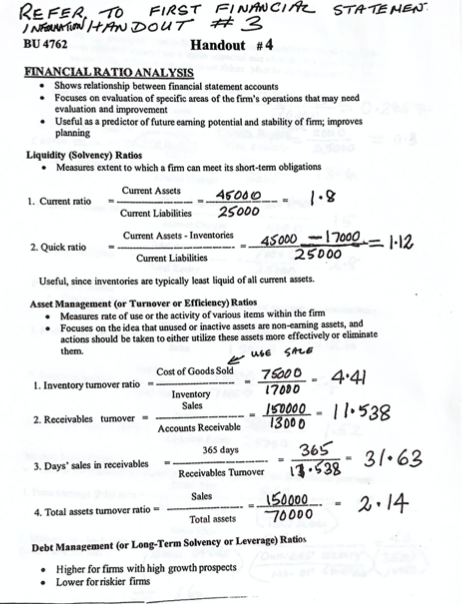
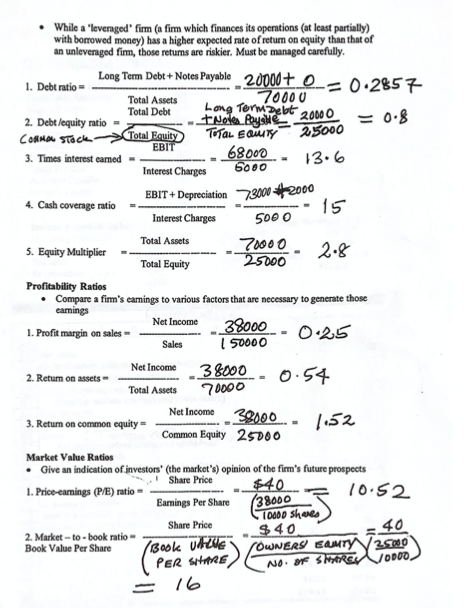
The economics of times O'sk - Finance Handout #3 1. Long-term Debt FINANCIAL STATEMENT Balance Sheet Information (12/31/17) Marketable Securities $5,000 Wages Payable 8,000 Accounts Receivable 13,000 Inventory 17,000 20,000 Property, Plant & Equipment 25,000 Taxes Payable 5,000 Accounts Payable 12,000 Owner's Equity ? 10,000 10 Income Statement Info. (1/1/17 - 12/31/17) 0 Operating Expenses $ 75,000 Interest Expenses 5,000 150,000 2,000 Depreciation UBE Taxes 30,000 00 Cash Other Supplementary Data Cash Dividend $20,000 Number of Shares 10,000 Common Stock Price $40 / share Inventory (12/31/13) $13,000 Net sales 26 B MICRODRIVE A ICDE 58 59 Net sales 60 Costs of goods sold except depreciation 61 Depreciation and amortization 62 Other operating expenses 63 Earnings before interest and taxes (EBIT) 64 Less interest 65 Pre-tax earnings 67 Net Income before preferred dividends' 68 Preferred dividends 69 Net Income available to common stockholders 70 71 Additional Information 72 Common dividends 74 Number of common shares 75 Stock price per share 76 77 Per Share Data 78 Earnings per share, EPS 79 Dividends per share, DPS 80 Book value per share, BVPS F 2016 S 5,000 23,800 200 500 $ 500 120 $ 380 152 $ 228 8 $ 220 G 2015 $ 4,760 3,560 170 480 $ 550 100 $ 450 180 $ 270 8 $ 262 66 Taxes tan come tax rate=4%) 73 Addition to retained earnings 03 S50 $170 50 $27 $48 $214 50 $40 9 $4.40 $1.00 $29.40 $5.24 $0.96 $26.00 $ OPERATING CAPITAL 2016 MORODVE A BCD E F G 01 Assets 2016 2015 Cash and equivalents $ 50 $ 60 2 short-term investments 40 3 Accounts receivable 500 380 4. Inventories 1,000 820 5 Total current assets 1,550 $ 1,300 6 Net plant and equipment 2,000 1,700 7 Total assets $ 3,550 $3,000 8 9 Liabilities and Equlty 0 Accounts payable 200 $ 190 1 Notes payable 280 130 2 Accruals 300 280 3 Total current liabilities $ 780 $ 600 14. Long-term bonds 1,200 1,000 5 Total llabilities 1,980 $ 1,600 16 Preferred stock (1,000,000 shares) 100 100 17 common stock (50,000,000 shares) 500 500 18 Retained earnings 970 800 19 Total common equity $ 1,470 $ 1,300 50 Total liabilities and equity $ 3,550 $ 3,000 OPERATING CAPITAL - 2015 = NOW C 2015 + LTOA2015 (CA 2015 - CL 2015) + LTO A 2015 = 2490 = (1260 - 470) + 1100 = NOWC 2016 +LTOA2016 = (CP2016 - Chor <O A 2016 = 1550 500%it 2000 ) = 3050 =3050 NOTE : NOWC EWET OPERATING WORKIN CAPITAL ETOA = LONG TERM OPERATING ASSISTS REFER TO FIRST FINANCIAL STATE NEJ INTERNATION HANDOUT #3 BU 4762 Handout #4 FINANCIAL RATIO ANALYSIS Shows relationship between financial statement accounts Focuses on evaluation of specific areas of the firm's operations that may need evaluation and improvement Useful as a predictor of future caring potential and stability of fim; improves planning Liquidity (Solvency) Ratios Measures extent to which a fim can meet its short-term obligations Current Assets 1. Current ratio 45000 1.8 Current Liabilities 25000 Current Assets - Inventories 2. Quick ratio 45000-17000 = 1:12 Current Liabilities 25000 Useful, since inventories are typically least liquid of all current assets. Asset Management (or Turnover or Efficiency) Ratios Measures rate of use or the activity of various items within the firm Focuses on the idea that unused or inactive assets are non-earning assets, and actions should be taken to either utilize these assets more effectively or eliminate them. use SALE Cost of Goods Sold 75000 1. Inventory tumover ratio -- 4:41 Inventory 17000 Sales 1150000 - 11.538 2. Receivables tumover - Accounts Receivable 13000 365 days 365 3. Days' sales in receivables 31.63 Receivables Tumover 13.538 Sales 150000 4. Total assets tumover ratio 2.14 Total assets 70000 Debt Management (or Long-Term Solvency or Leverage) Ratios Higher for firms with high growth prospects Lower for riskier firms 25000 13.6 While a 'leveraged' firm (a firm which finances its operations (at least partially) with borrowed money) has a higher expected rate of retum on equity than that of an unleveraged fim, those retums are riskier. Must be managed carefully. Long Term Debe + Notes Payable 20000+ 0 = 0.2857 1. Debt ratio- Total Assets 70000 Total Debt Long Term Debt 2. Debt /equity ratio- tole Ryske 2000 CORMA Stock Total Equity TOTAL EQUITY EBIT 3. Times interest camed - 68000 Interest Charges Gooo 4. Cash coverage ratio EBIT + Depreciation 72000 72000 15 Interest Charges 5000 Total Assets 5. Equity Multiplier 70000 2.8 Total Equity 25000 Profitability Ratios Compare a fimm's camings to various factors that are necessary to generate those earings Net Income 1. Profit margin on sales - 38000 0-25 Sales 150000 Net Income 2. Return on assets - 38000 0.54 Total Assets 70000 3. Return on common equity - 38000 1152 Common Equity 25000 Market Value Ratios Give an indication of investors' (the market's) opinion of the firm's future prospects Share Price 1. Price-eamings (P/E) ratio $40 10.52 Earnings Per Share 38000 TDOOD Shorts Share Price $40 2. Market -to-book ratio Book Value Per Share (Book VALUE OWNERS Camry 25000 Net Income 40 DD00 No. of SRS PER SHARE 16