Looking at the data and spreadsheet, how well do you think Tesla is managing its inventory? What trends and patterns stand out to you if any?


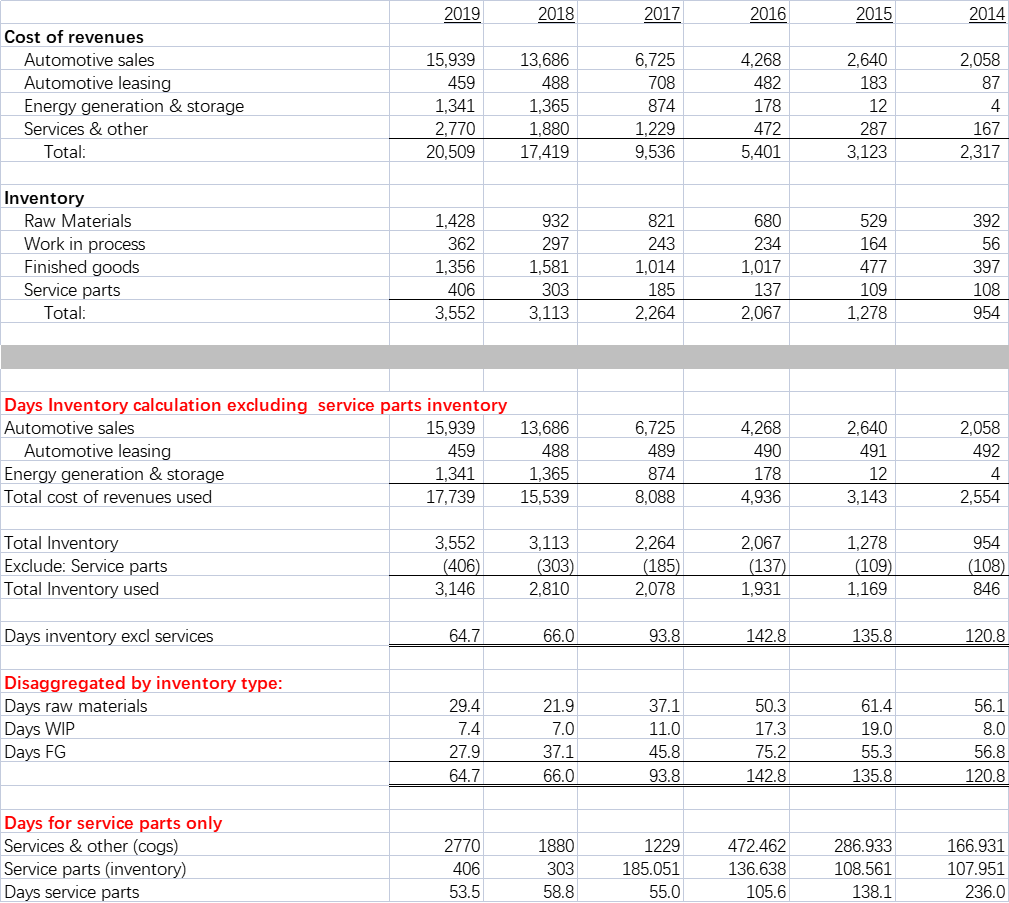
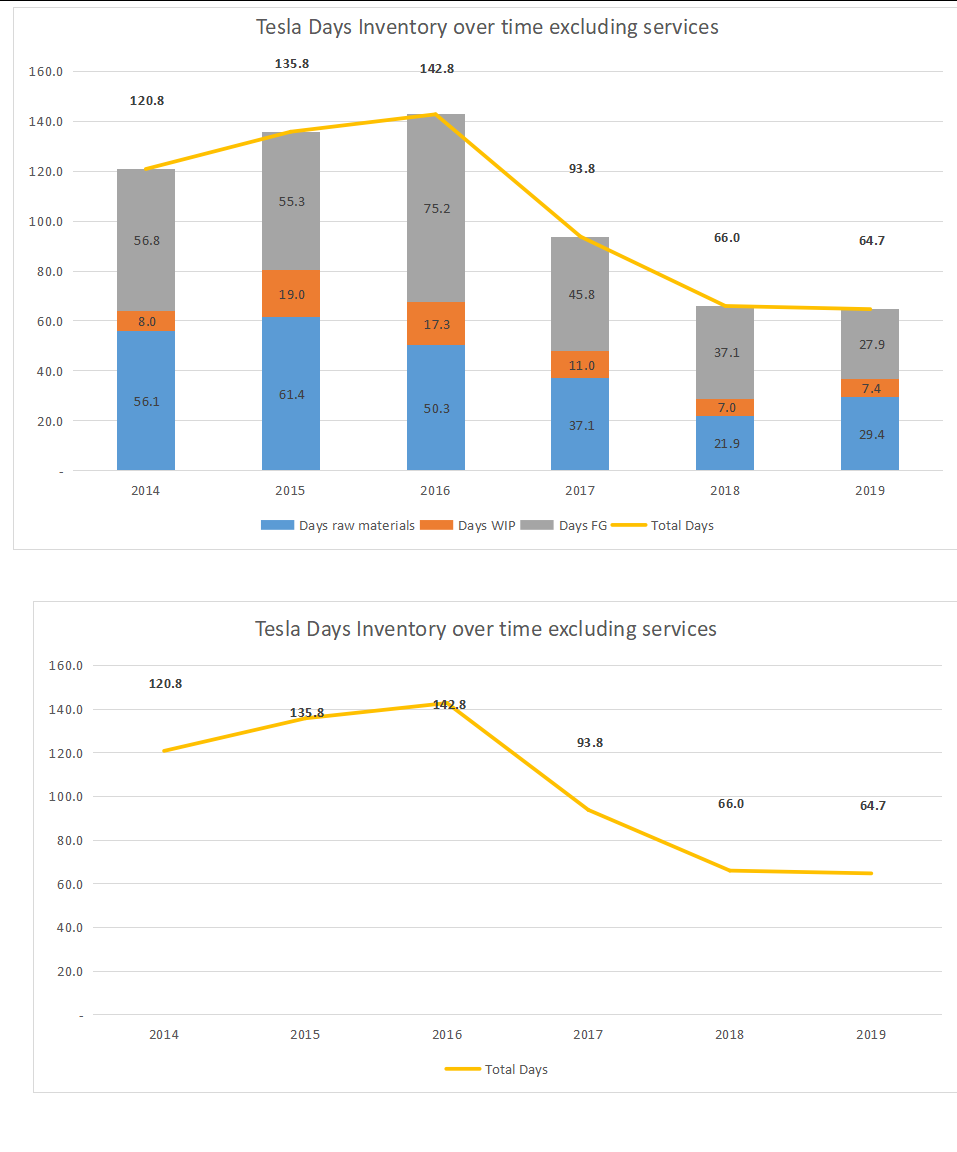
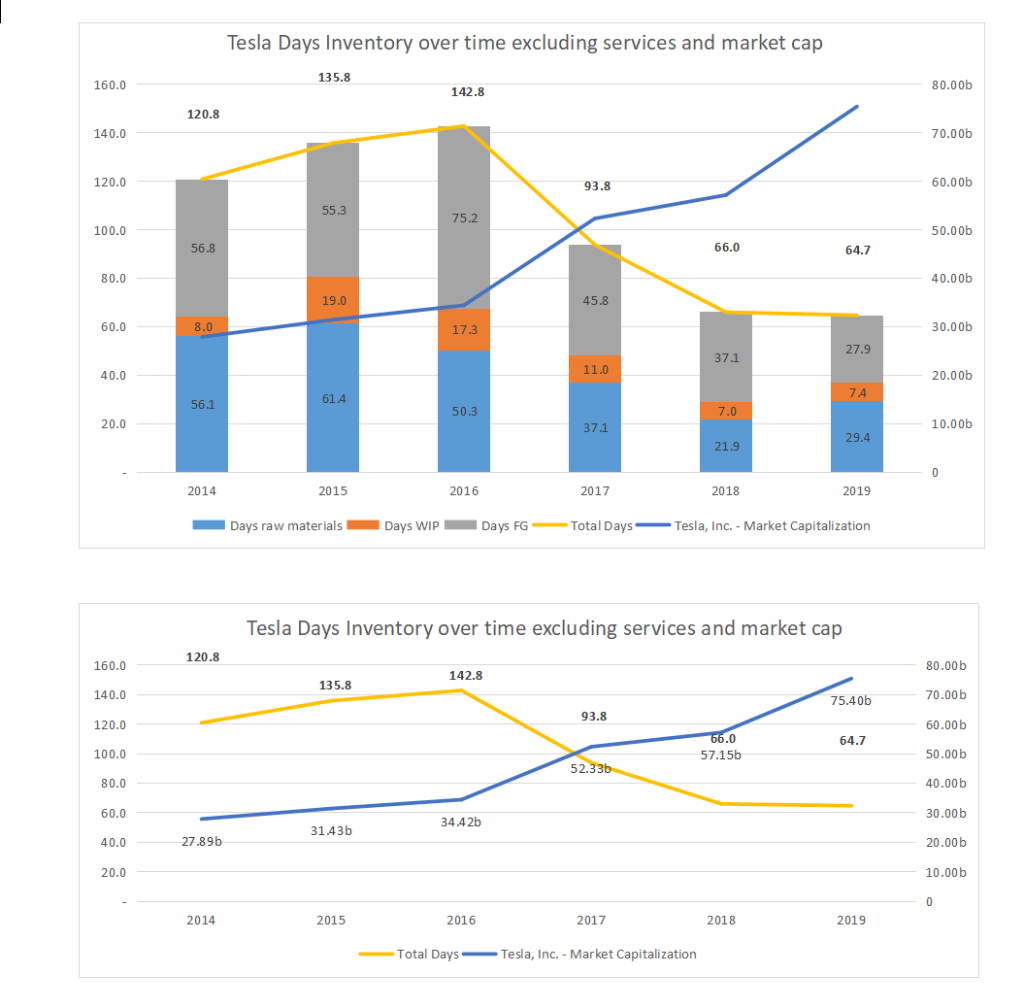
2019 2018 2017 2016 2015 2014 Cost of revenues Automotive sales Automotive leasing Energy generation & storage Services & other Total: 15,939 459 1,341 2.770 20,509 13,686 488 1,365 1,880 17,419 6,725 708 874 1,229 9,536 4,268 482 178 472 5,401 2,640 183 12 287 2,058 87 4 167 2,317 3,123 Inventory Raw Materials Work in process Finished goods Service parts 1,428 362 1,356 406 3,552 932 297 1,581 303 3,113 821 243 1,014 185 2,264 680 234 1,017 137 2,067 529 164 477 109 1,278 392 56 397 108 954 Total: Days Inventory calculation excluding service parts inventory Automotive sales 15,939 Automotive leasing 459 Energy generation & storage 1.341 Total cost of revenues used 17,739 13.686 488 1,365 15,539 6,725 489 874 8.088 4,268 490 178 4,936 2,640 491 12 3,143 2,058 492 4 2,554 Total Inventory Exclude: Service parts Total Inventory used 3,552 (406) 3,146 3.113 (303) 2,810 2.264 (185) 2,078 2,067 (137) 1,931 1,278 (109) 1,169 954 (108) 846 Days inventory excl services 64.7 66.0 93.8 142.8 135.8 120.8 Disaggregated by inventory type: Days raw materials Days WIP Days FG 29.4 7.4 27.9 64.7 21.9 7.0 37.1 66.0 37.1 11.0 45.8 93.8 50.3 17.3 75.2 142.8 61.4 19.0 55.3 135.8 56.1 8.0 56.8 120.8 1880 Days for service parts only Services & other (cogs) Service parts (inventory) Days service parts 2770 406 303 1229 185.051 55.0 472.462 136.638 105.6 286.933 108.561 138.1 166.931 107.951 236.0 53.5 58.8 2015 2016 2014 Days raw materials Days WIP Days FG Total Days Tesla, Inc. - Market Market cap data from capital iq 56.1 8.0 56.8 120.8 27.89b 61.4 19.0 55.3 135.8 31.43b 2017 50.3 17.3 75.2 142.8 34.42b 2018 37.1 11.0 45.8 93.8 52.33b 2019 21.9 7.0 37.1 66.0 57.15b 29.4 7.4 27.9 64.7 75.40b Tesla Days Inventory over time excluding services 160.0 135.8 142.8 120.8 140.0 120.0 93.8 55.3 75.2 100.0 56.8 66.0 64.7 80.0 19.0 45.8 60.0 8.0 17.3 27.9 37.1 40.0 11.0 61.4 7.4 56.1 50.3 7.0 20.0 37.1 29.4 21.9 2014 2015 2016 2017 2018 2019 Days raw materials Days WIP Days FG Total Days Tesla Days Inventory over time excluding services 160.0 120.8 140.0 142.8 135.8 93.8 120.0 100.0 66.0 64.7 80.0 60.0 40.0 20.0 2014 2015 2016 2017 2018 2019 Total Days Tesla Days Inventory over time excluding services and market cap 135.8 160.0 80.00 142.8 120.8 140.0 70.000 120.0 93.8 60.00 55.3 75.2 100.0 50.00 56.8 66.0 64.7 80.0 40.00b 19.0 45.8 60.0 8.0 17.3 30.00 27.9 37.1 40.0 11.0 20.00 61.4 7A 56.1 50.3 7.0 20.0 37.1 10.00b 29.4 21.9 0 2014 2015 2016 2017 2018 2019 Days raw materials Days WIP Days FG Total Days - Tesla, Inc. - Market Capitalization Tesla Days Inventory over time excluding services and market cap 120.8 160.0 80.00b 142.8 135.8 140.0 70.00 75.40b 93.8 120.0 60.00 64.7 66.0 57.15b 100.0 52.33b 50.00b 40.000 80.0 60.0 30.000 34.42b 31.43b 40.0 27.89b 20.005 20.0 10.00b 0 0 2014 2015 2016 2017 2018 2019 -Total Days Tesla, Inc. - Market Capitalization


