

Question
Looking at the following financial statements, give the company's input on the following: 1. overall financial status. 2. analysis on revenue 3. company's profitability 4.
Looking at the following financial statements, give the company's input on the following:
1. overall financial status. 2. analysis on revenue 3. company's profitability 4. comments on the use of existing capital, debt, or equity
* the company beging evaluated is Gap Inc.
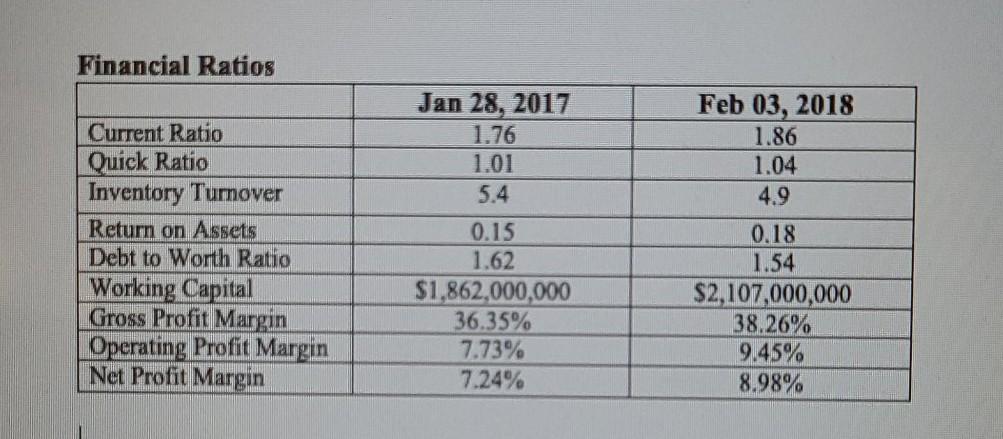
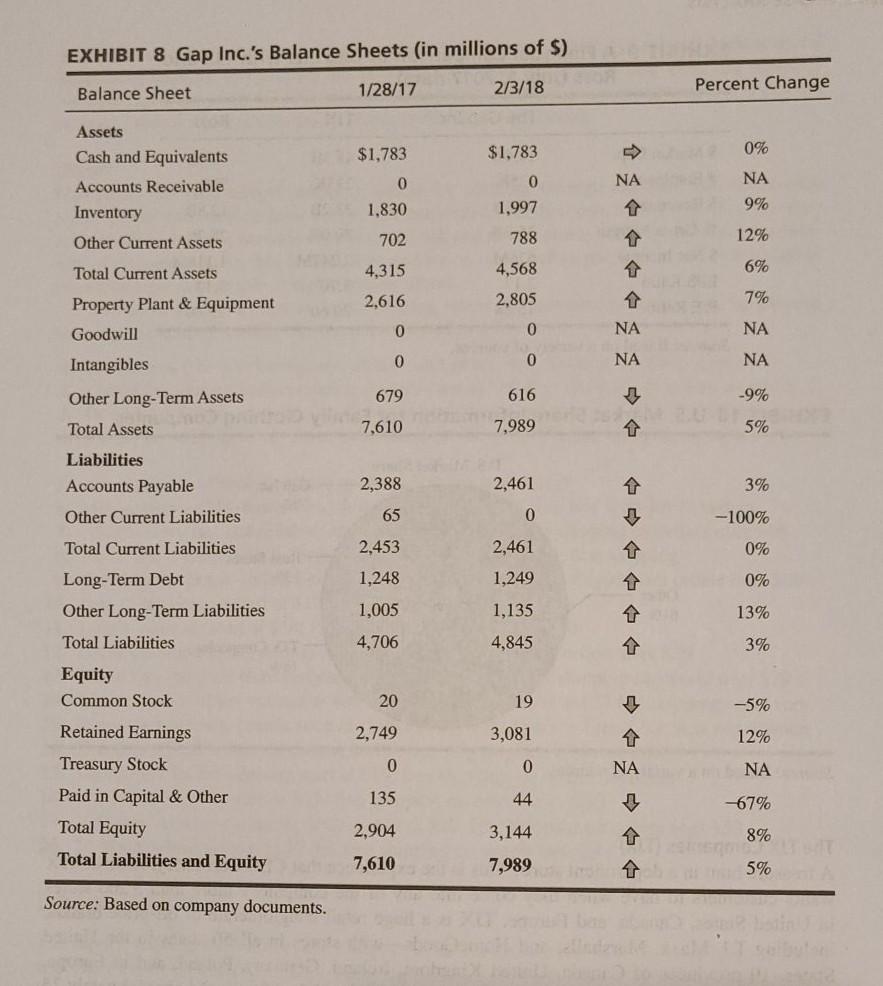
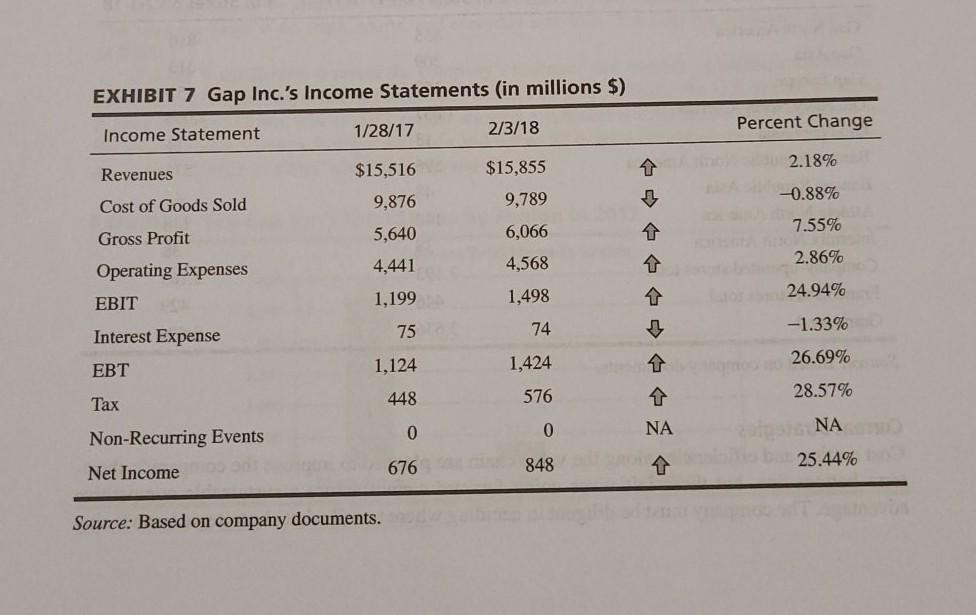
Financial Ratios Current Ratio Quick Ratio Inventory Turnover Return on Assets Debt to Worth Ratio Working Capital Gross Profit Margin Operating Profit Margin Net Profit Margin Jan 28, 2017 1.76 1.01 5.4 0.15 1.62 $1,862,000,000 36.35% 7.73% 7.24% Feb 03, 2018 1.86 1.04 4.9 0.18 1.54 $2,107,000,000 38.26% 9.45% 8.98% EXHIBIT 8 Gap Inc.'s Balance Sheets (in millions of $) Balance Sheet 1/28/17 2/3/18 Percent Change 0% $1.783 $1,783 NA Assets Cash and Equivalents Accounts Receivable Inventory Other Current Assets 0 1,830 0 1,997 788 NA 9% 702 T 12% Total Current Assets 4,315 4,568 6% 2,616 2,805 Property Plant & Equipment Goodwill 1 NA 7% NA 0 0 0 0 NA NA Intangibles Other Long-Term Assets Total Assets 679 616 -9% 7,610 7,989 T 5% Liabilities Accounts Payable Other Current Liabilities 2,388 2,461 3% 65 0 -100% 2,461 1 0% 2,453 1,248 1,249 0% 1,005 1,135 13% 4,706 4,845 3% Total Current Liabilities Long-Term Debt Other Long-Term Liabilities Total Liabilities Equity Common Stock Retained Earnings Treasury Stock Paid in Capital & Other 20 19 -5% 2,749 3,081 12% 0 0 NA NA 135 44 67% 2,904 3,144 8% Total Equity Total Liabilities and Equity 7,610 7,989 5% Source: Based on company documents. EXHIBIT 7 Gap Inc.'s Income Statements (in millions $) Income Statement Percent Change 1/28/17 2/3/18 2.18% Revenues $15,516 -0.88% Cost of Goods Sold 9,876 5,640 $15,855 9,789 6,066 4,568 1,498 7.55% Gross Profit 4,441 Operating Expenses 2.86% EBIT 24.94% 1,199 75 74 -1.33% Interest Expense 1,124 EBT 1,424 1 26.69% 448 Tax 576 28.57% 0 0 NA NA Non-Recurring Events 676 Net Income 848 1 25.44% Source: Based on company documentsStep by Step Solution
There are 3 Steps involved in it
Step: 1

Get Instant Access to Expert-Tailored Solutions
See step-by-step solutions with expert insights and AI powered tools for academic success
Step: 2

Step: 3
Ace Your Homework with AI
Get the answers you need in no time with our AI-driven, step-by-step assistance
Get Started
Fundamentals of Investing
Authors: Scott B. Smart, Lawrence J. Gitman, Michael D. Joehnk
12th edition
ISBN: 978-0133075403, 133075354, 9780133423938, 133075400, 013342393X, 978-0133075359