Answered step by step
Verified Expert Solution
Question
1 Approved Answer
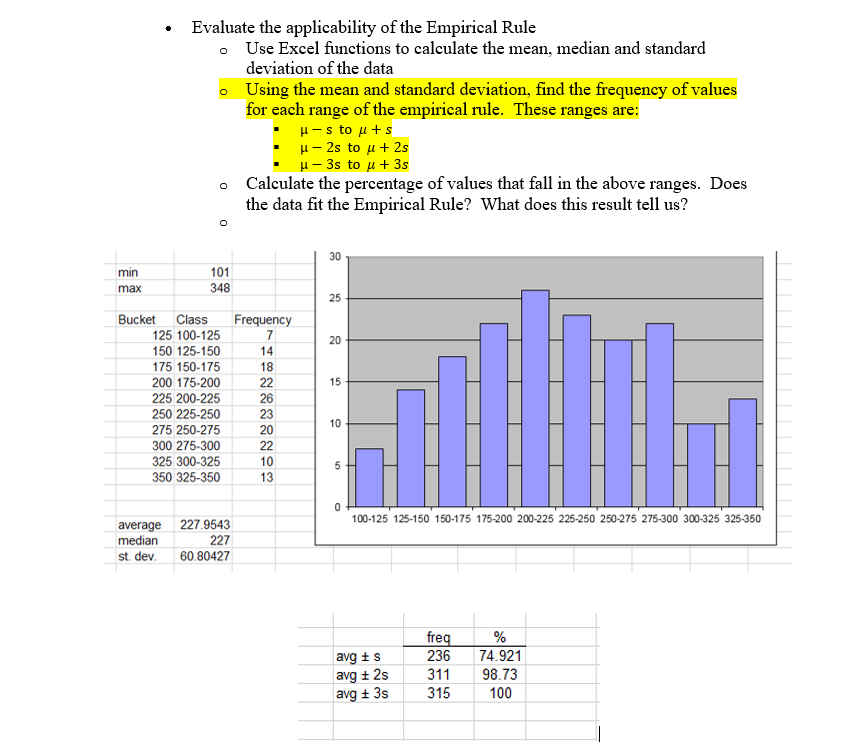
Looking for some assistance with the highlighted part. How am I able to calulate both the frequency of values using the mean and standard deviation
Looking for some assistance with the highlighted part. How am I able to calulate both the frequency of values using the mean and standard deviation (Highlighted portion of the question) and also how then am i able to output the percentages in the range. (under the % bin shown at the bottom). Any assistance would be appreciated 
Step by Step Solution
There are 3 Steps involved in it
Step: 1

Get Instant Access to Expert-Tailored Solutions
See step-by-step solutions with expert insights and AI powered tools for academic success
Step: 2

Step: 3

Ace Your Homework with AI
Get the answers you need in no time with our AI-driven, step-by-step assistance
Get Started


