Question: Looking for tutoring help as I form an opinion on the following question. Assignment on Forecasting The worksheet Data! of the Excel file
Looking for tutoring help as I form an opinion on the following question.

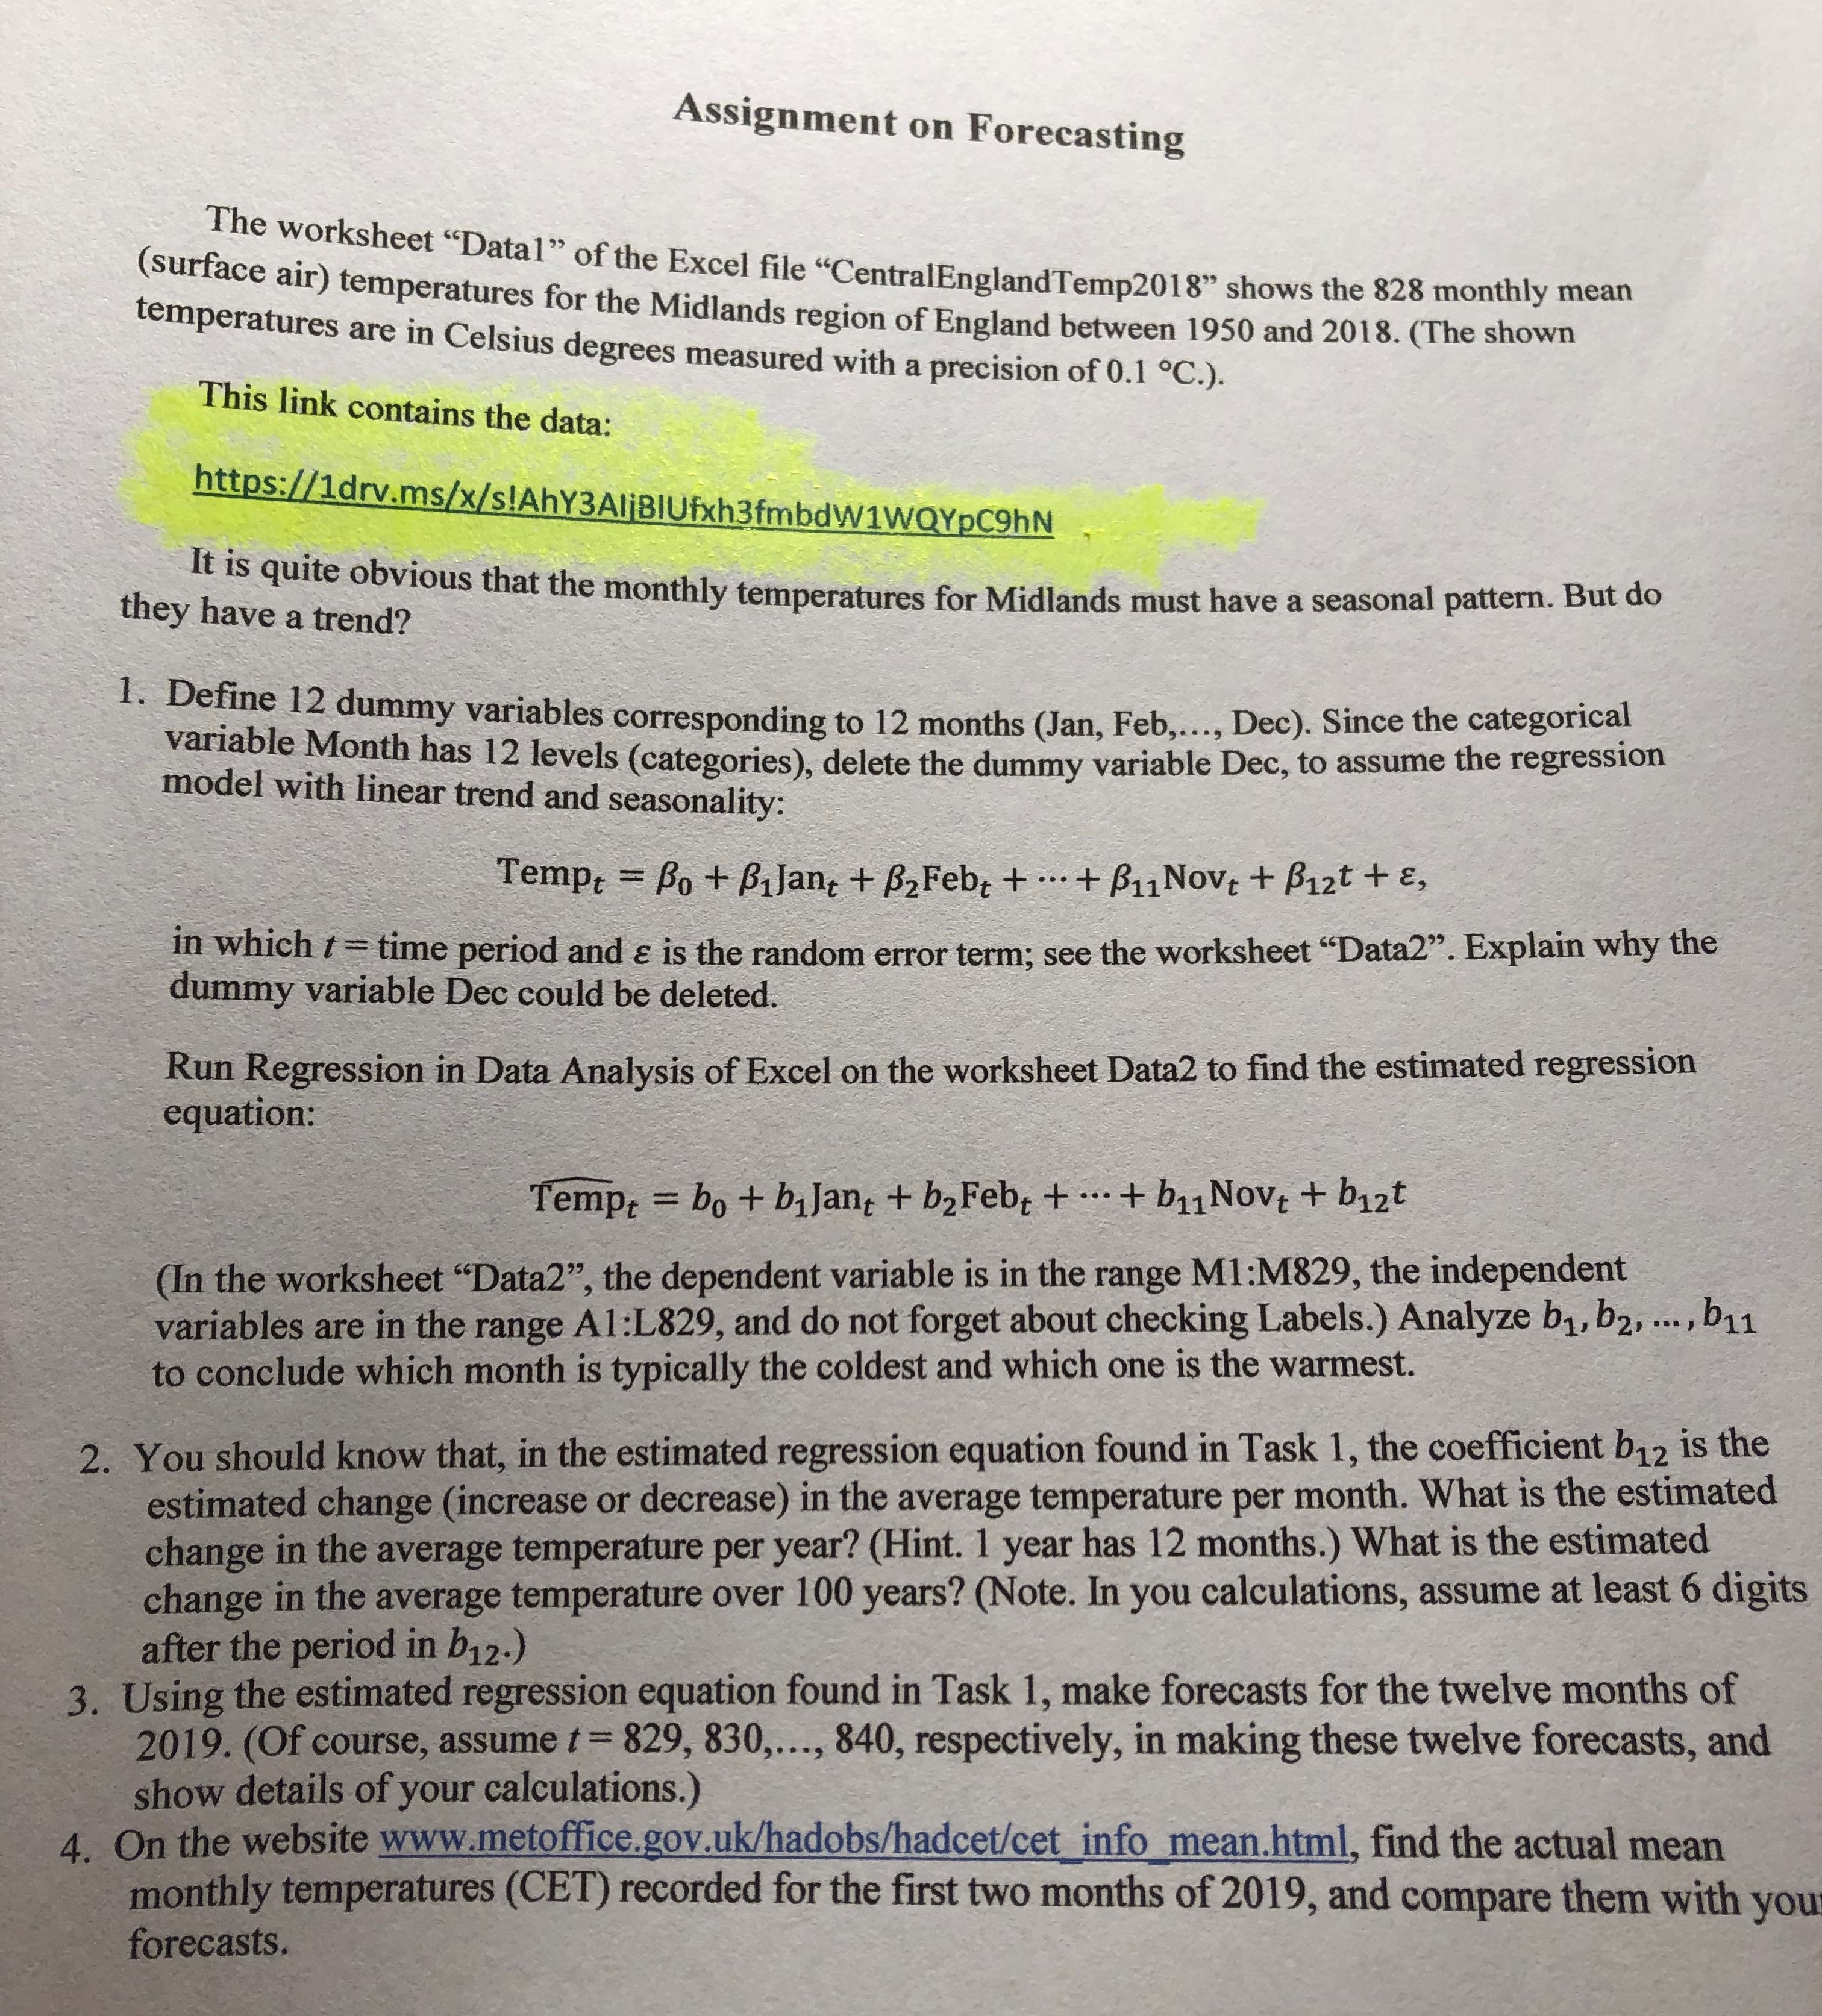
Assignment on Forecasting The worksheet " Data! " of the Excel file " Central England Temp 2018 " shows the $28 monthly mean ( surface air ) temperatures for the Midlands region of England between 1950 and 2018 . ( The shown temperatures are in Celsius degrees measured with a precision of 0 . 1 C . ) . This link contains the data : https : / / 1 dru . ms / X / s ! Ah Y 3 Ali BI U FXh 3 fmbowlW Q Y PCShN they have a trend ? It is quite obvious that the monthly temperatures for Midlands must have a seasonal pattern . But do 1 . Define 12 dummy variables corresponding to 12 months ( Jan , Feb , ... . Dec ) . Since the categorical variable Month has 12 levels ( categories ) , delete the dummy variable Dec , to assume the regression model with linear trend and seasonality :* Tempt = Bo + Bilang + BzFeb, + ... + BIL NOVE + Bizt TE , in which I = time period and & is the random error term ; see the worksheet " Data 2 " . Explain why the dummy variable Dec could be deleted .* Run Regression in Data Analysis of Excel on the worksheet Data ? to find the estimated regression equation :" Tempt = bo + b, Jang + 62 Feb, + ... + by1 NOVE + bizt ( In the worksheet " Data ? " , the dependent variable is in the range MI : M829 , the independent variables are in the range A1 : 1. 829 , and do not forget about checking Labels . ) Analyze b1 , 6 2 . .... 61 1 to conclude which month is typically the coldest and which one is the warmest . 2 . You should know that , in the estimated regression equation found in Task I , the coefficient biz is the estimated change ( increase or decrease ) in the average temperature per month . What is the estimated change in the average temperature per year ? ( Hint . 1 year has 12 months . ) What is the estimated change in the average temperature over 100 years ? ( Note . In you calculations , assume at least 6 digits after the period in 6 12 . ) 3 . Using the estimated regression equation found in Task I , make forecasts for the twelve months of 2019 . ( Of course , assume 1 = 829, 830 , .... 840 , respectively , in making these twelve forecasts , and show details of your calculations . ) 4 . On the website www . metoffice . gov . uk / hadobs / hadcet / cet info mean . html , find the actual mean monthly temperatures ( CEI ) recorded for the first two months of 2019 , and compare them with you forecasts
Step by Step Solution
There are 3 Steps involved in it

Get step-by-step solutions from verified subject matter experts


