

Answered step by step
Verified Expert Solution
Question
1 Approved Answer
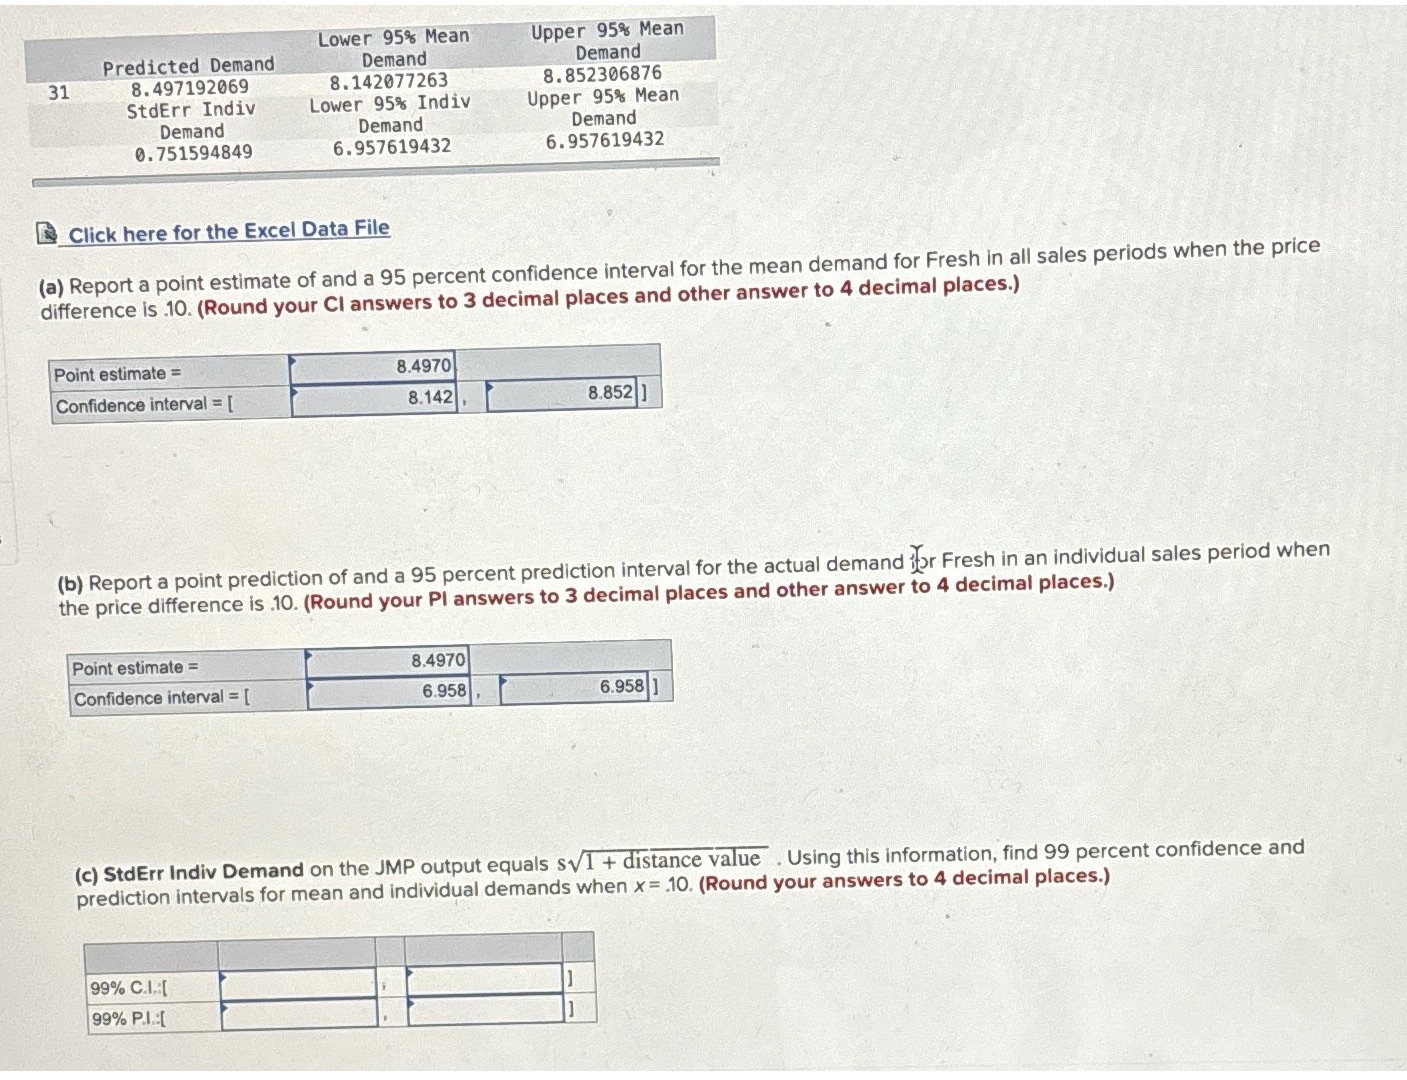
Lower 95% Mean Upper 95% Mean Predicted Demand Demand Demand 31 8. 497192069 8. 142077263 8. 852306876 StdErr Indiv Lower 95% Indiv Upper 95% Mean

Step by Step Solution
There are 3 Steps involved in it
Step: 1

Get Instant Access to Expert-Tailored Solutions
See step-by-step solutions with expert insights and AI powered tools for academic success
Step: 2

Step: 3
Ace Your Homework with AI
Get the answers you need in no time with our AI-driven, step-by-step assistance
Get Started
Computing The Continuous Discretely Integer-Point Enumeration In Polyhedra
Authors: Matthias Beck, Sinai Robins
2nd Edition
1493929690, 9781493929696