Question
LTL infrastructure limited has three divisions. cement division has its manufacturing plant in gujarat. it sells about two thirds of its cement in gujarat and
LTL infrastructure limited has three divisions. cement division has its manufacturing plant in gujarat. it sells about two thirds of its cement in gujarat and remaining in rajasthan and madhya pradesh. the fertilizer division manufacturers and markets urea in gujarat, maharashtra and madhya pradesh. the power generation division, under a long term agreement, supplies power to government of gujarat.
LTL has so dar used the corporate wide weighted average cost of capital (wacc) as a cut off for allocating funds to the division. the company uses capm to calculate the cost of equity. its regression beta is 1.5. investment of company have long gestation periods and lives. the yield on the 10 year government bond is 6.1% and the risk premium is 8%. the current debt equity of the company is 1:8:1. being highly capital intensive company, it's target debt equity is 2:5:1. the companys cost of debt is 10% and it applies to all divisions. the marginal tax rate applicable is 25%
the power division has agrued that firms cost of capital should not be used for evaluating projects in their division. their agrument is that the target debt equity ratio od power division is 4:1 and therefore their cost of capital should be lower. the target debt equity ratio for fertilizer is 2:1 and cements is 2:5:1
the ceo however is of the view that only corporate level cost of capital should be used to discount cash flows. the cfo doesn't agree to this and he has decided go calculate divisional wacc using the bottoms up approach (he used only one comparable firm)
comparable for power division is not available
1. estimate LTL's wacc
2. state your position with regard to choice between single company cutoff rate vs multiple division cut off rates
3. calculate cost of capital for each division (cost of debt for divisions is the same as company
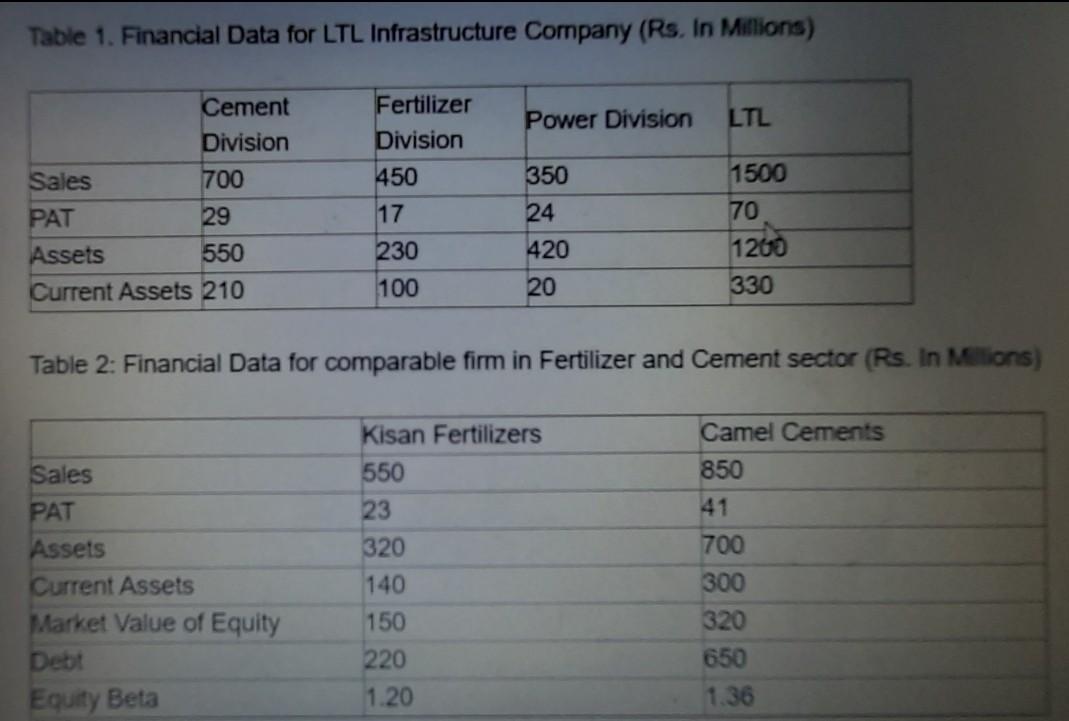
Table 1. Financial Data for LTL Infrastructure Company (Rs. In Millions) Cement Division Sales PAT 700 29 Assets 550 Current Assets 210 Fertilizer Division Sales PAT Assets Current Assets Market Value of Equity Debt Equity Beta 450 17 230 100 Power Division 350 24 420 20 LTL Table 2: Financial Data for comparable firm in Fertilizer and Cement sector (Rs. In Millions) Kisan Fertilizers 550 23 320 140 150 220 1.20 1500 70 1200 330 Camel Cements 850 41 700 300 320 650 1.36 Table 1. Financial Data for LTL Infrastructure Company (Rs. In Millions) Cement Division Sales PAT 700 29 Assets 550 Current Assets 210 Fertilizer Division Sales PAT Assets Current Assets Market Value of Equity Debt Equity Beta 450 17 230 100 Power Division 350 24 420 20 LTL Table 2: Financial Data for comparable firm in Fertilizer and Cement sector (Rs. In Millions) Kisan Fertilizers 550 23 320 140 150 220 1.20 1500 70 1200 330 Camel Cements 850 41 700 300 320 650 1.36
Step by Step Solution
3.32 Rating (173 Votes )
There are 3 Steps involved in it
Step: 1
Question 2 Given that each division has a distinct debttoequity ...
Get Instant Access to Expert-Tailored Solutions
See step-by-step solutions with expert insights and AI powered tools for academic success
Step: 2

Step: 3

Ace Your Homework with AI
Get the answers you need in no time with our AI-driven, step-by-step assistance
Get Started


