Answered step by step
Verified Expert Solution
Question
1 Approved Answer
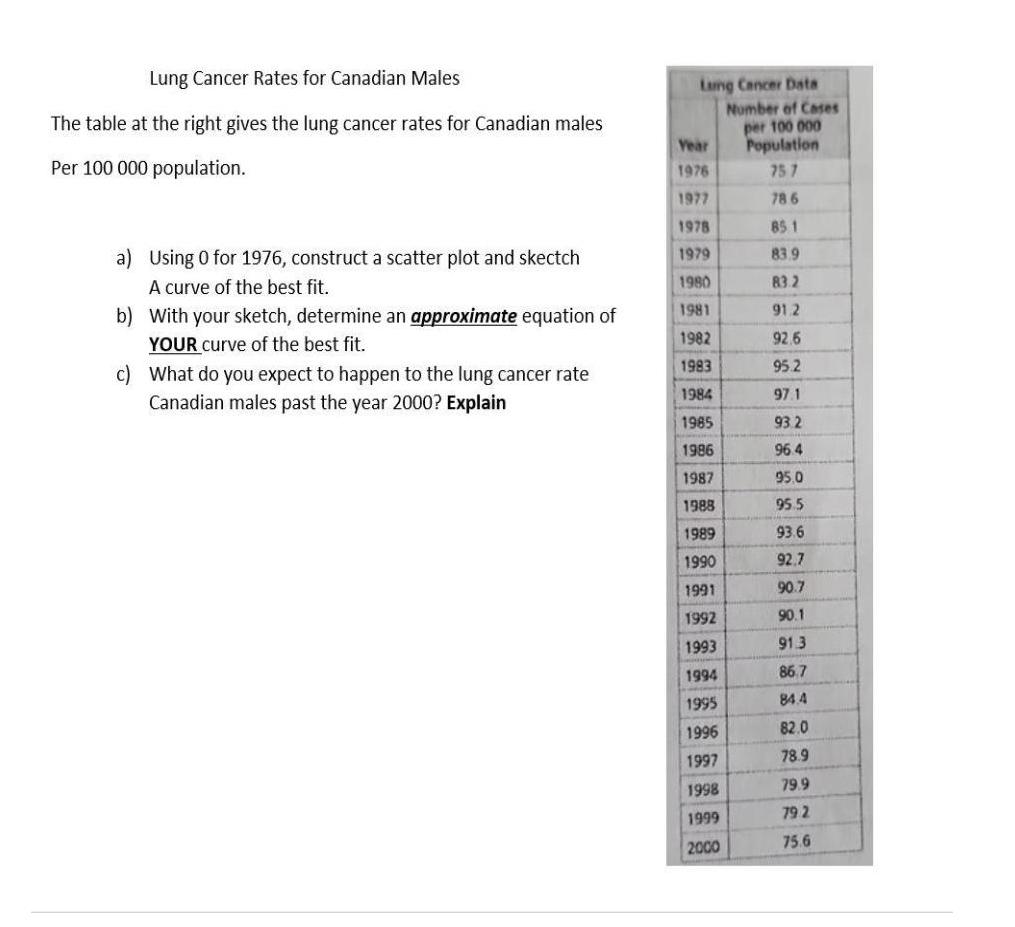
Lung Cancer Rates for Canadian Males The table at the right gives the lung cancer rates for Canadian males Per 100 000 population. a)

Lung Cancer Rates for Canadian Males The table at the right gives the lung cancer rates for Canadian males Per 100 000 population. a) Using 0 for 1976, construct a scatter plot and skectch A curve of the best fit. b) with your sketch, determine an approximate equation of YOUR curve of the best fit. c) What do you expect to happen to the lung cancer rate Canadian males past the year 2000? Explain Lung Cancer Data Year 1976 1977 1978 1979 1980 1981 1982 1983 1984 1985 1986 1987 1988 1989 1990 1991 1992 1993 1994 1995 1996 1997 1998 1999 2000 Number of Cases per 100 000 Population 75 7 78 6 85 1 83.9 83.2 91,2 92.6 95.2 97.1 93.2 96.4 95.0 95.5 93.6 92.7 90.7 90.1 91.3 86.7 84.4 82.0 78.9 79.9 79 2 75.6
Step by Step Solution
There are 3 Steps involved in it
Step: 1
a Using 0 for 1976 construct a scatter plot and skectch A curve of the best fit A scatter plot of th...
Get Instant Access to Expert-Tailored Solutions
See step-by-step solutions with expert insights and AI powered tools for academic success
Step: 2

Step: 3

Ace Your Homework with AI
Get the answers you need in no time with our AI-driven, step-by-step assistance
Get Started


