Question: m 30C Haze n 4. Question 4 An online store wants to analyze various aspects of using coupons, including the distribution of discounts and


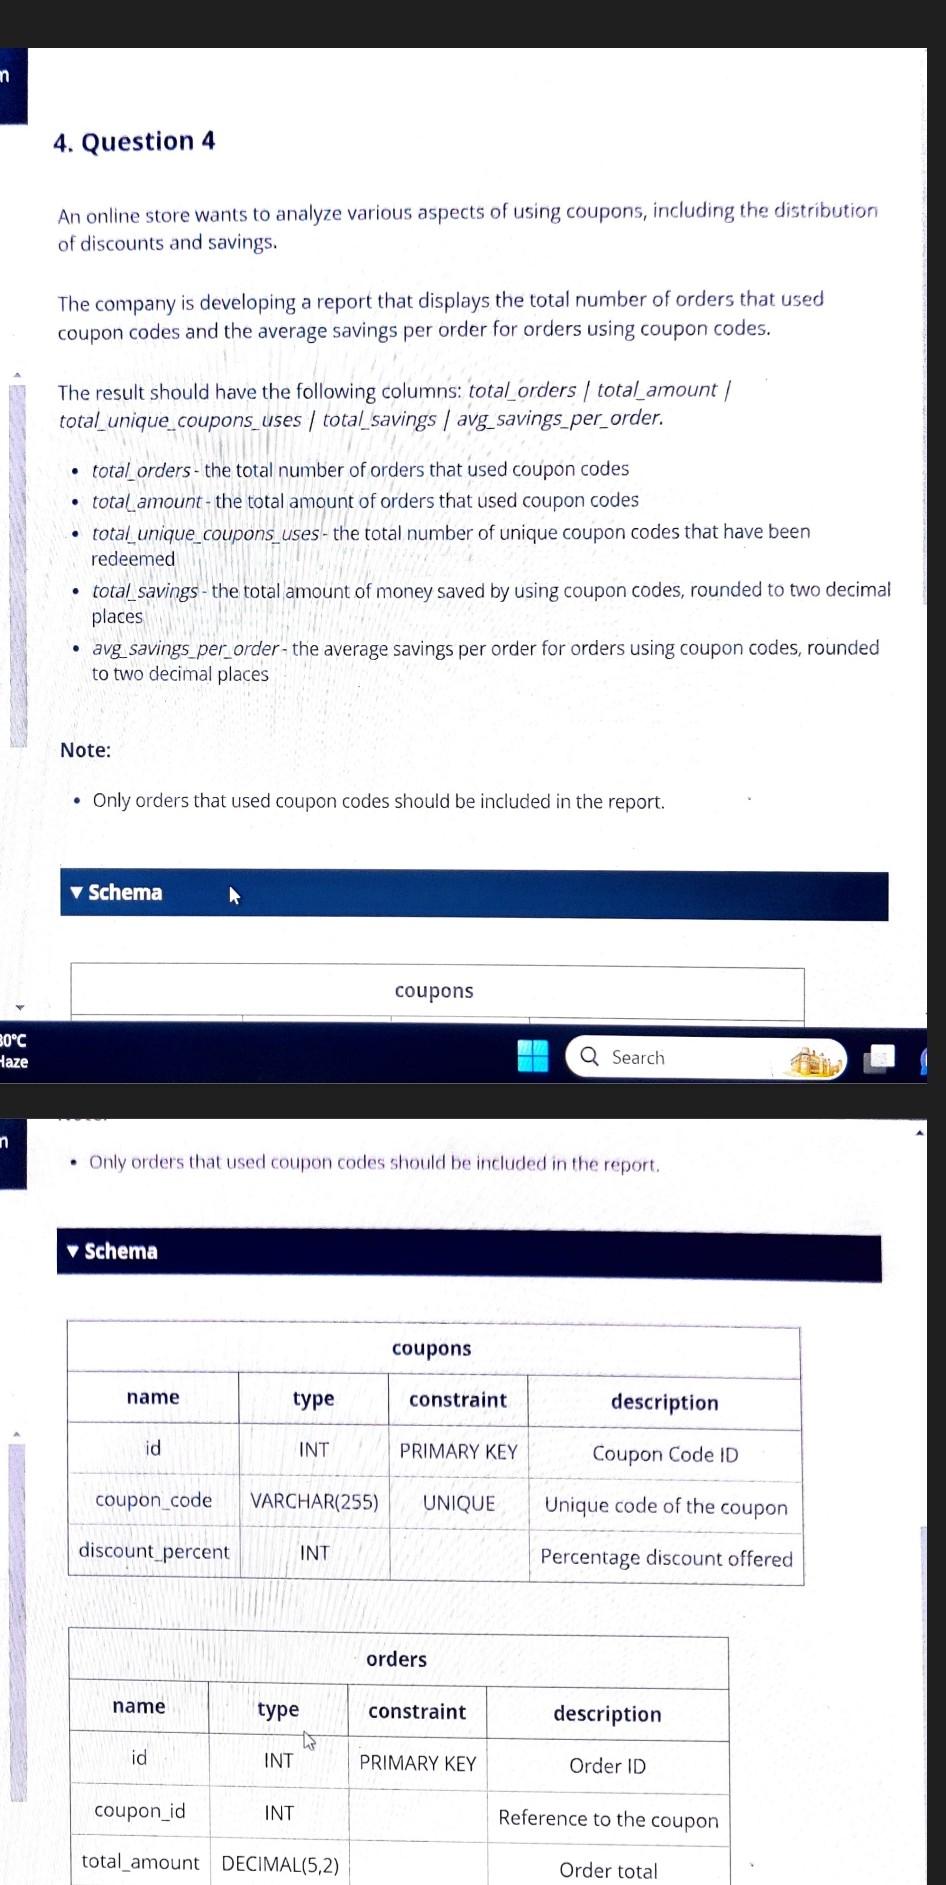
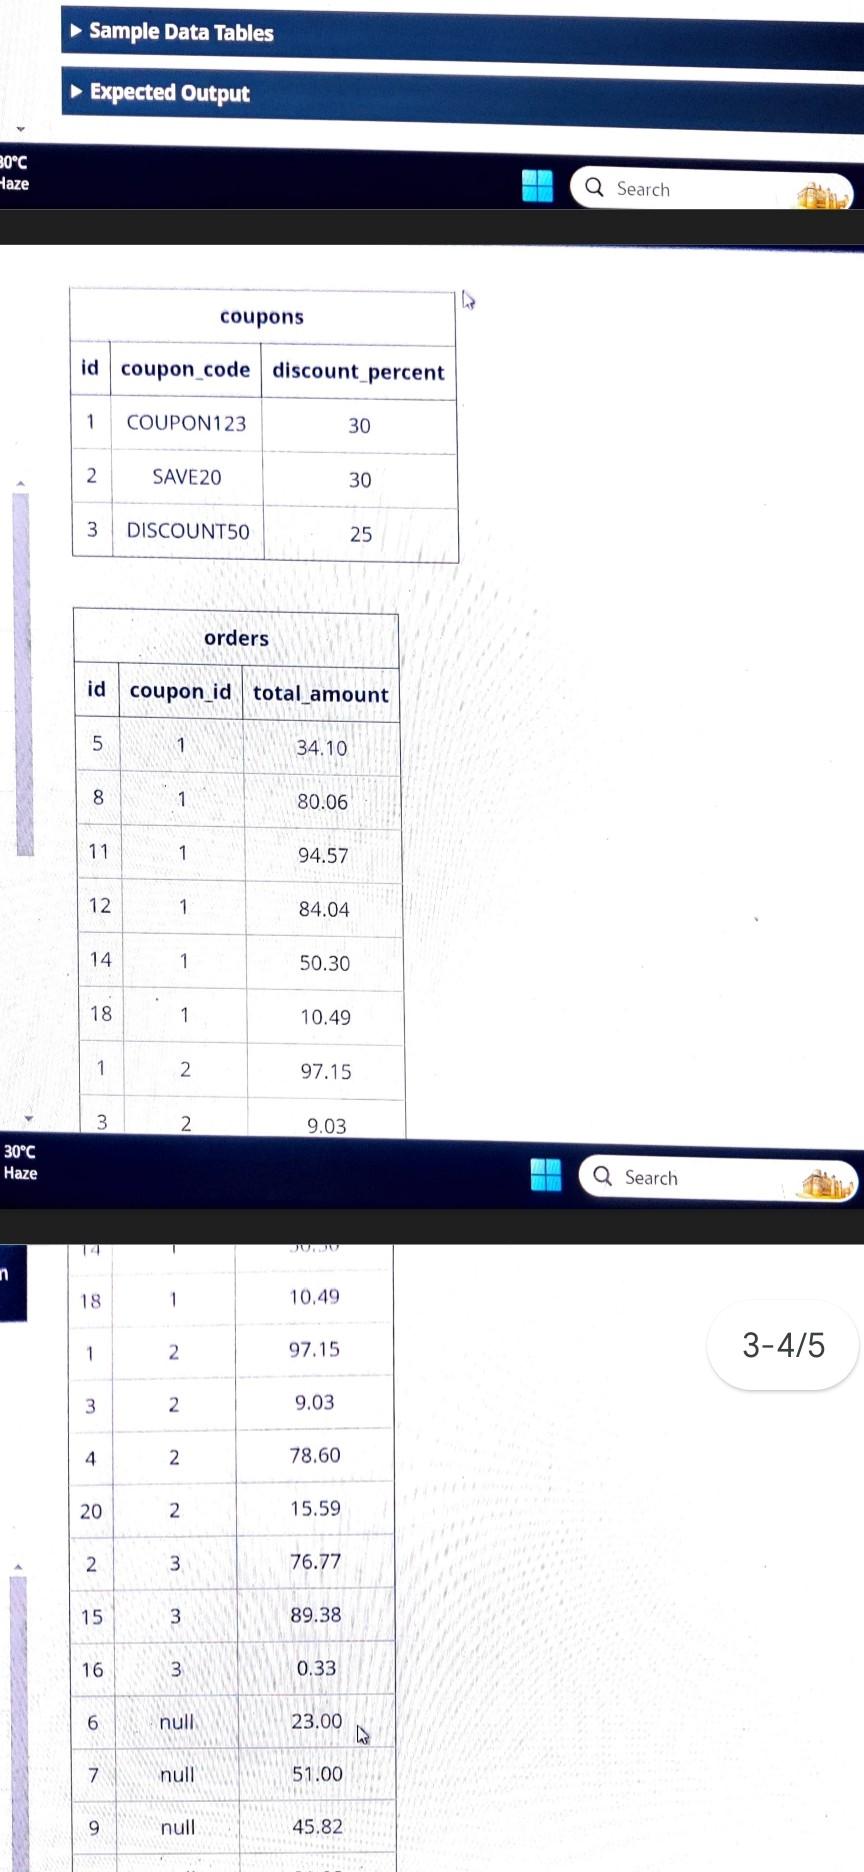
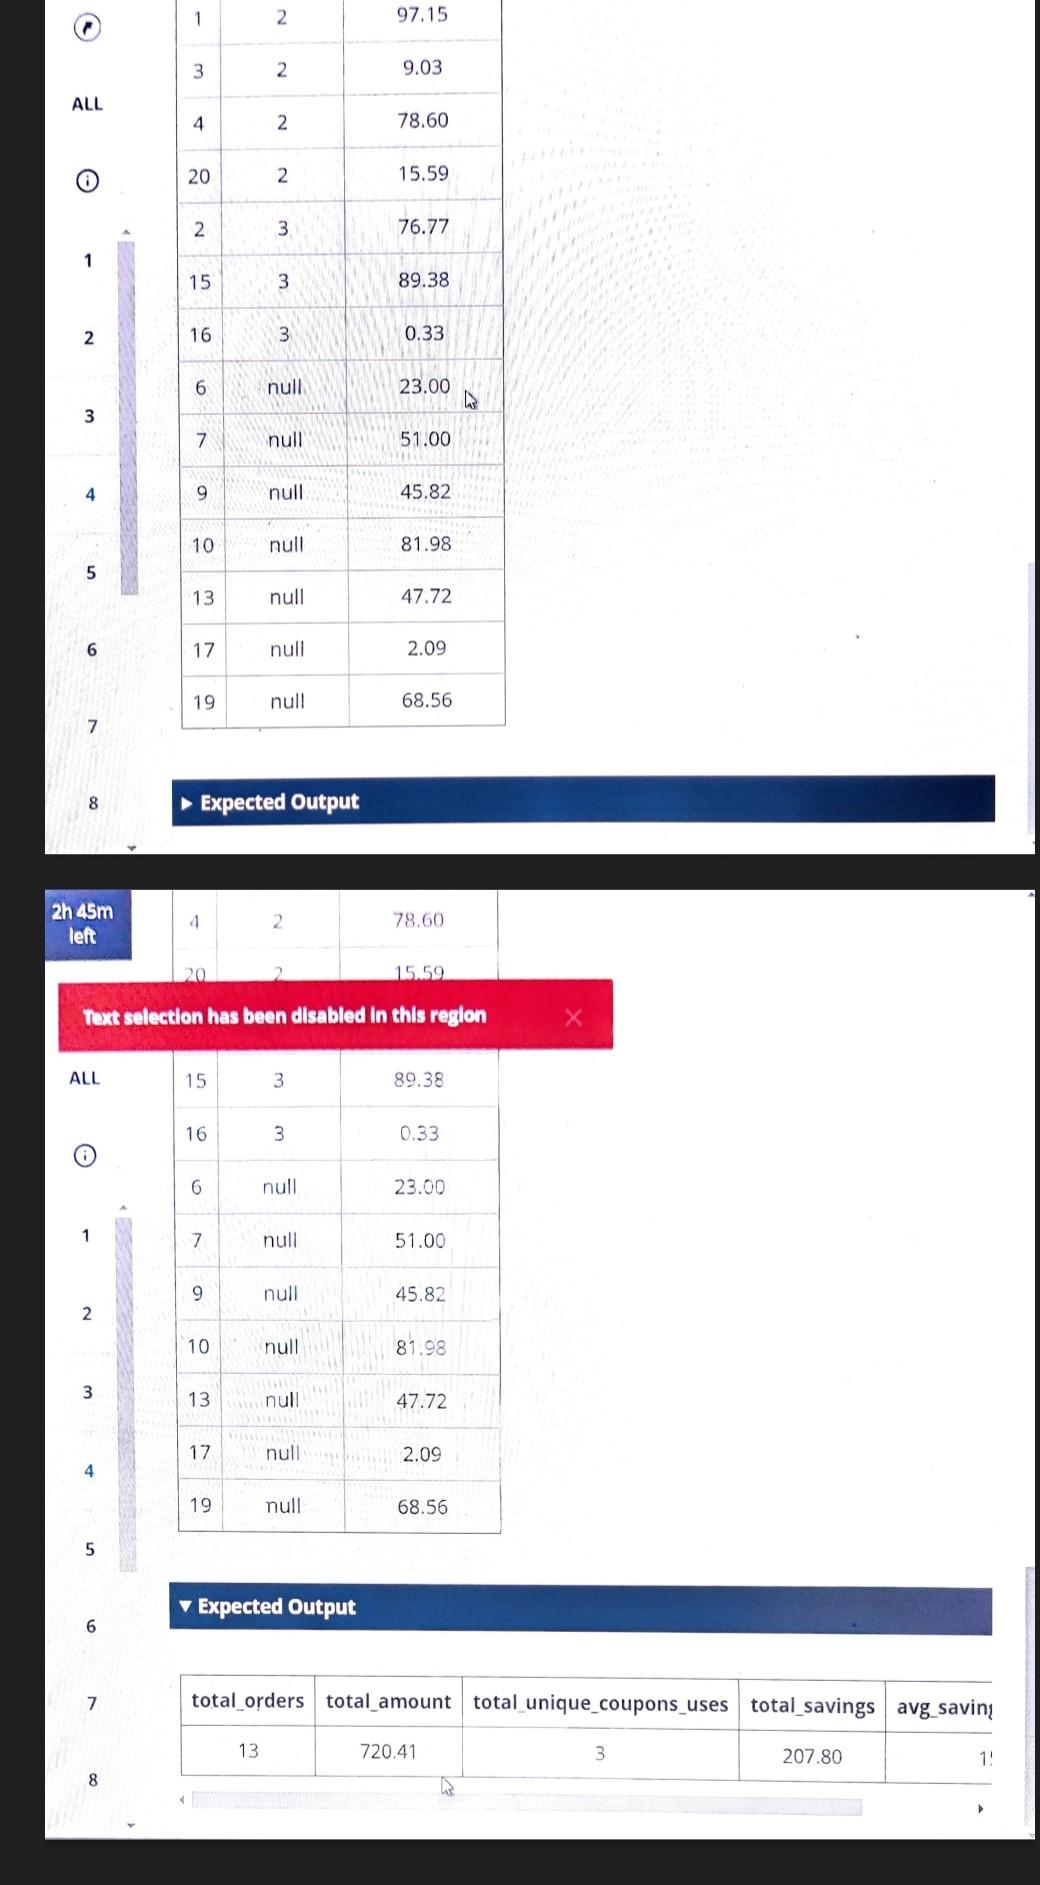
m 30C Haze n 4. Question 4 An online store wants to analyze various aspects of using coupons, including the distribution of discounts and savings. The company is developing a report that displays the total number of orders that used coupon codes and the average savings per order for orders using coupon codes. The result should have the following columns: total_orders | total amount | total_unique_coupons_uses | total savings | avg_savings_per_order. . . total_orders- the total number of orders that used coupon codes total amount - the total amount of orders that used coupon codes total_unique_coupons_uses- the total number of unique coupon codes that have been . redeemed total_savings - the total amount of money saved by using coupon codes, rounded to two decimal places avg_savings_per_order- the average savings per order for orders using coupon codes, rounded to two decimal places Note: Only orders that used coupon codes should be included in the report. Schema Schema . Only orders that used coupon codes should be included in the report. name id coupon_code discount percent name id coupon_id type INT VARCHAR(255) type INT INT INT to coupons total amount DECIMAL(5,2) coupons constraint PRIMARY KEY UNIQUE orders constraint Q Search PRIMARY KEY description Coupon Code ID Unique code of the coupon Percentage discount offered description Order ID Reference to the coupon Order total 30C Haze 30C Haze n Sample Data Tables Expected Output id coupon_code discount_percent 1 COUPON123 2 3 5 8 11 12 14 18 id coupon_id total amount 1 3 14 1 18 3 4 20 2 15 16 6 7 9 SAVE20 DISCOUNT50 1 1 1 1 1 1 1 2 2 2 2 2 2 3 coupons 3 3 null null null orders 34.10 80.06 94.57 84.04 50.30 9.03 10.49 JUDU 97.15 10.49 97.15 9.03 30 78.60 15.59 76.77 30 89.38 25 0.33 23.00 51.00 45.82 D Q Search Q Search 3-4/5 ALL O 3 4 5 6 7 8 2h 45m left ALL O 1 2 3 4 5 6 7 1 S 3 4 20 2 15 16 6 7 9 10 13 17 19 4 20 15 16 a. 6 7 9 10 13 17 2 19 2 Expected Output 2 2 13 3 3 3 null null null 15.59 Text selection has been disabled in this region null null null null 2 3 3 null null null null null null null Expected Output 97.15 9.03 78.60 15.59 76.77 89.38 0.33 23.00 51.00 45.82 81.98 47.72 2.09 68.56 78.60 89.38 0.33 23.00 51.00 45.82 81.98 47.72 2.09 68.56 total_orders total amount total_unique_coupons_uses total_savings avg_savin 720.41 4 3 207.80 1!
Step by Step Solution
There are 3 Steps involved in it
To solve this problem we need to write a query that calculates the following 1 Total Orders Count of ... View full answer

Get step-by-step solutions from verified subject matter experts


