Question: M ABC Cookie Co. Control ABC Cookie Company Control Chart Problems Practice Quiz Complete the problem in advance of taking the mini-quiz, so you will
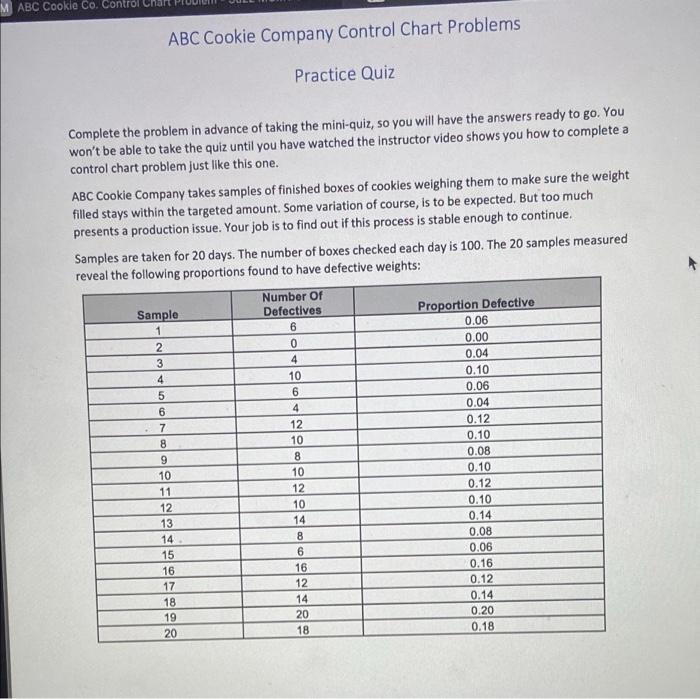
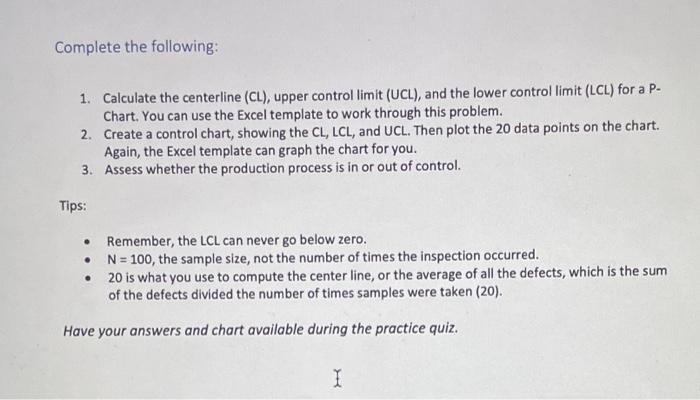
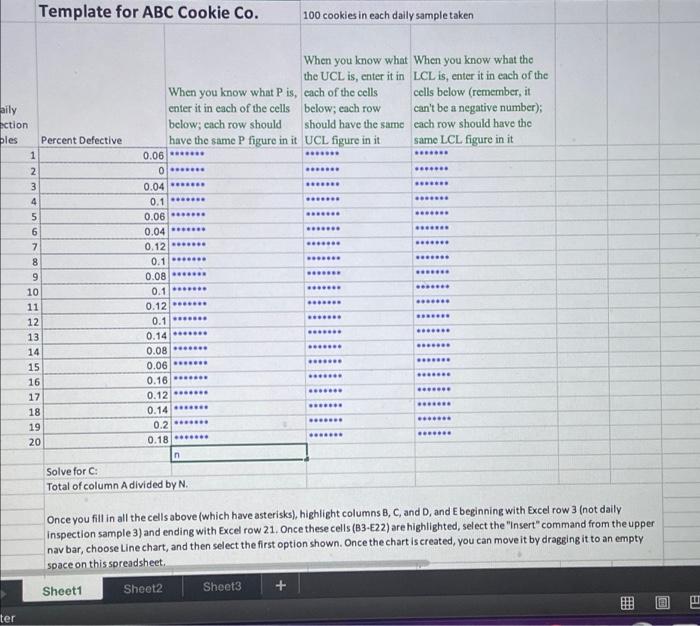
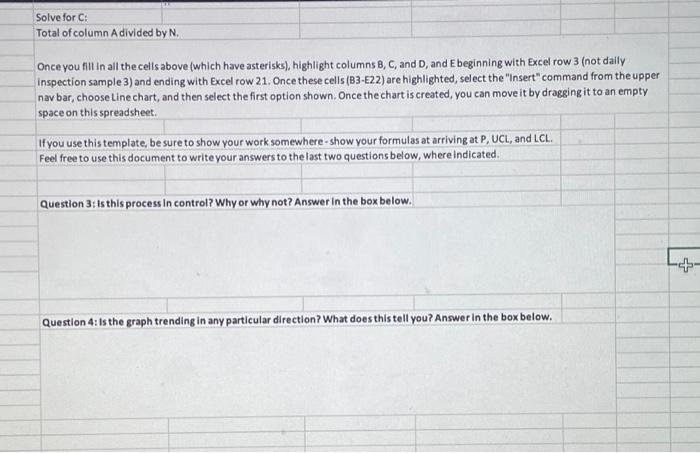
M ABC Cookie Co. Control ABC Cookie Company Control Chart Problems Practice Quiz Complete the problem in advance of taking the mini-quiz, so you will have the answers ready to go. You won't be able to take the quiz until you have watched the instructor video shows you how to complete a control chart problem just like this one. ABC Cookie Company takes samples of finished boxes of cookies weighing them to make sure the weight filled stays within the targeted amount. Some variation of course, is to be expected. But too much presents a production issue. Your job is to find out if this process is stable enough to continue. Samples are taken for 20 days. The number of boxes checked each day is 100. The 20 samples measured reveal the following proportions found to have defective weights: Number Of Sample Defectives Proportion Defective 0.06 1 6 0.00 0 0.04 4 0.10 10 6 0.06 0.04 4 12 0.12 10 0.10 0.08 8 10 0.10 12 0.12 10 0.10 14 0.14 8 0.08 6 0.06 16 0.16 12 0.12 14 0.14 20 0.20 18 0.18 2 3 4 5 6 7 8 9 10 11 12 13 14 15 16 17 18 19 20 Complete the following: 1. Calculate the centerline (CL), upper control limit (UCL), and the lower control limit (LCL) for a P- Chart. You can use the Excel template to work through this problem. 2. Create a control chart, showing the CL, LCL, and UCL. Then plot the 20 data points on the chart. Again, the Excel template can graph the chart for you. 3. Assess whether the production process is in or out of control. Remember, the LCL can never go below zero. N = 100, the sample size, not the number of times the inspection occurred. 20 is what you use to compute the center line, or the average of all the defects, which is the sum of the defects divided the number of times samples were taken (20). Have your answers and chart available during the practice quiz. I Tips: Template for ABC Cookie Co. ter 100 cookies in each daily sample taken When you know what P is, enter it in each of the cells below; each row should When you know what When you know what the the UCL is, enter it in LCL is, enter it in each of the each of the cells cells below (remember, it below; each row should have the same can't be a negative number); cach row should have the same LCL figure in it have the same P figure in it UCL figure in it 0.06 ******* ******* ******* ******* 0....... 0.04 ******* ******* ******* 0.1 ******* ******* 0.06 ******* ******* 0.04. ******* 0.12 ******* ******* 0.1 ******* ******* 0.08 ******* ******* 0.1***** ******* ******* 0.12. ******* ******* 0.1 ******* ******* 0.14 ******* ******* 0.08 ******* ******* 0.06. ******* ******* 0.16 ******* ******* 0.12. ******* ******* 0.14 ******* ******* ******* ******* ******* 0.2 0.18 ******* ******* n Solve for C: Total of column A divided by N. Once you fill in all the cells above (which have asterisks), highlight columns B, C, and D, and E beginning with Excel row 3 (not daily inspection sample 3) and ending with Excel row 21. Once these cells (B3-E22) are highlighted, select the "Insert" command from the upper nav bar, choose Line chart, and then select the first option shown. Once the chart is created, you can move it by dragging it to an empty space on this spreadsheet. Sheet1 Sheet2 Sheet3 + 8 aily ection ples Percent Defective 1 2 3 4 5 6 7 8 9 10 11 12 13 14 15 16 17 18 19 20 18 Solve for C: Total of column A divided by N. Once you fill in all the cells above (which have asterisks), highlight columns B, C, and D, and E beginning with Excel row 3 (not daily inspection sample 3) and ending with Excel row 21. Once these cells (B3-E22) are highlighted, select the "Insert" command from the upper nav bar, choose Line chart, and then select the first option shown. Once the chart is created, you can move it by dragging it to an empty space on this spreadsheet. If you use this template, be sure to show your work somewhere-show your formulas at arriving at P, UCL, and LCL. Feel free to use this document to write your answers to the last two questions below, where indicated. Question 3: Is this process in control? Why or why not? Answer in the box below. Question 4: Is the graph trending in any particular direction? What does this tell you? Answer in the box below