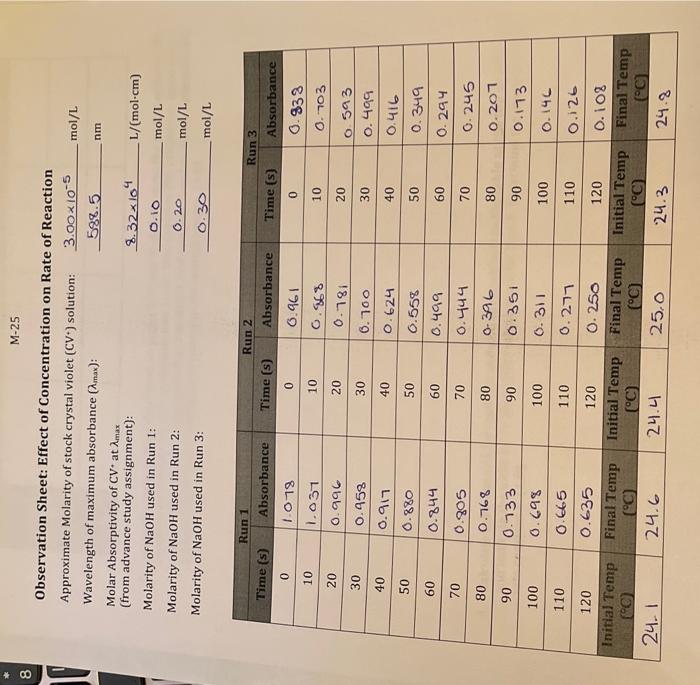
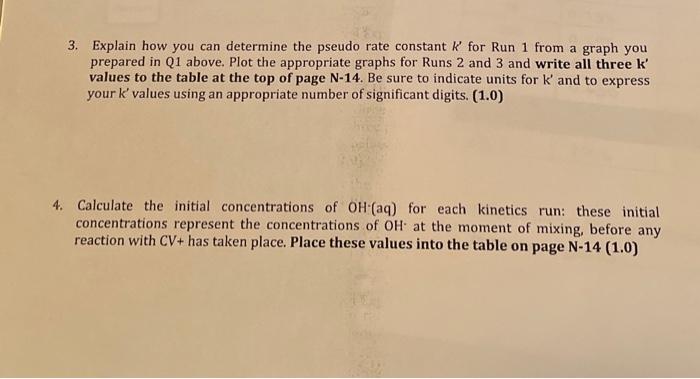
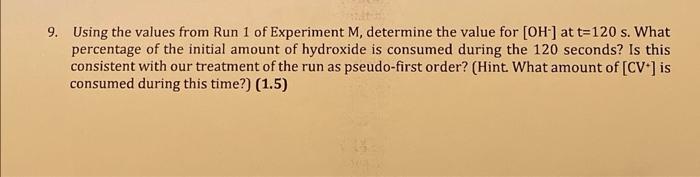
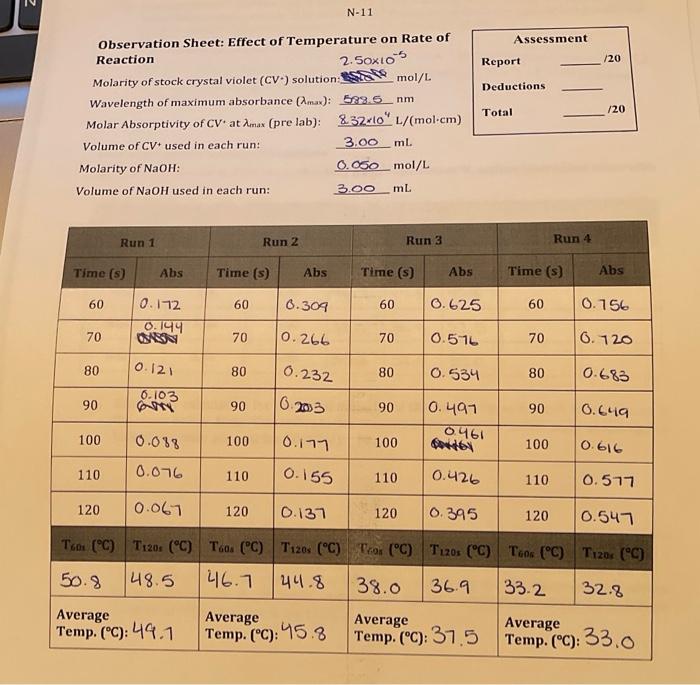
M-25 Observation Sheet: Effect of Concentration on Rate of Reaction 3. Explain how you can determine the pseudo rate constant k for Run 1 from a graph you prepared in Q1 above. Plot the appropriate graphs for Runs 2 and 3 and write all three k values to the table at the top of page N14. Be sure to indicate units for k and to express your k values using an appropriate number of significant digits. (1.0) Calculate the initial concentrations of OH(aq) for each kinetics run: these initial concentrations represent the concentrations of OHat the moment of mixing, before any reaction with CV+ has taken place. Place these values into the table on page N14(1.0) 5. Using the ratio method described on pages M5 and M6, determine the partial order of the reaction with respect to the hydroxide ion. To do this, perform the calculation three times: compare Run 1 to Run 2 , compare Run 1 to Run 3, and compare Run 2 to Run 3. Determine the average of your three results, and round it to the nearest integer. (1.0) 6. Calculate the value of k for each run and add these values to the table at the top of this page rate constant k,(1.0) 9. Using the values from Run 1 of Experiment M, determine the value for [OH]at t=120s. What percentage of the initial amount of hydroxide is consumed during the 120 seconds? Is this consistent with our treatment of the run as pseudo-first order? (Hint. What amount of [CV +]is consumed during this time?) (1.5) Assessment Report 120 Deductions Total 120 Part II: Activation Energy Calculations For the calculations in Part II use the data from Experiment N, unless instructed otherwise 1. Show your calculation for the initial molarity of OH-for the Experiment N kinetics runs in the space below. Note: This refers to the concentration of the OH - at the point of mixing (i.e. before reaction: account for dilution!). (0.5) 2. Based on the order of reaction with respect to CV+, as determined in Experiment M, prepare (for each of the four runs) the appropriate integrated rate law plot and determine k ' and k for each run. For best results, use only the data points from 60 s to 120 s inclusive for each run. Do not attach these plots to your lab report: simply report the experimental values for k and k in the above table, and include the corresponding temperature values from Observation Sheet N-11. (1.5) Complete the following table relating the temperature to reaction rate. (1.0) 1. Plot ln(k) vs. 1/T (K1) using Google Sheets or some other computer spreadsheet software. Your graph should include a best-fit line from software-calculated linear regression analysis. Include the data from Exp M Run 1 as a data point as well. Attach the plot to your lab report. (1.0) 2. In the space below, write the linear equation (of the form y=mx+b ) for the best-fit line for the data plotted above. Be sure to include units, even if they are absent in the equation as it appears in your software. Clearly identify and label both the slope and the y-intercept portions of this equation. (1.0) 3. Using the value of the slope of the best fit line, calculate the activation energy (E0) for the reaction of CV and OH:(1.5) 4. Using the value of the y-intercept of the best fit line for the graph, calculate the preexponential factor (A) for the reaction of CV and OH:. (1.0) 5. Calculate the value of k that should be obtained from a run performed at 5C Show your calculations. (1.5) End of Report M-25 Observation Sheet: Effect of Concentration on Rate of Reaction 3. Explain how you can determine the pseudo rate constant k for Run 1 from a graph you prepared in Q1 above. Plot the appropriate graphs for Runs 2 and 3 and write all three k values to the table at the top of page N14. Be sure to indicate units for k and to express your k values using an appropriate number of significant digits. (1.0) Calculate the initial concentrations of OH(aq) for each kinetics run: these initial concentrations represent the concentrations of OHat the moment of mixing, before any reaction with CV+ has taken place. Place these values into the table on page N14(1.0) 5. Using the ratio method described on pages M5 and M6, determine the partial order of the reaction with respect to the hydroxide ion. To do this, perform the calculation three times: compare Run 1 to Run 2 , compare Run 1 to Run 3, and compare Run 2 to Run 3. Determine the average of your three results, and round it to the nearest integer. (1.0) 6. Calculate the value of k for each run and add these values to the table at the top of this page rate constant k,(1.0) 9. Using the values from Run 1 of Experiment M, determine the value for [OH]at t=120s. What percentage of the initial amount of hydroxide is consumed during the 120 seconds? Is this consistent with our treatment of the run as pseudo-first order? (Hint. What amount of [CV +]is consumed during this time?) (1.5) Assessment Report 120 Deductions Total 120 Part II: Activation Energy Calculations For the calculations in Part II use the data from Experiment N, unless instructed otherwise 1. Show your calculation for the initial molarity of OH-for the Experiment N kinetics runs in the space below. Note: This refers to the concentration of the OH - at the point of mixing (i.e. before reaction: account for dilution!). (0.5) 2. Based on the order of reaction with respect to CV+, as determined in Experiment M, prepare (for each of the four runs) the appropriate integrated rate law plot and determine k ' and k for each run. For best results, use only the data points from 60 s to 120 s inclusive for each run. Do not attach these plots to your lab report: simply report the experimental values for k and k in the above table, and include the corresponding temperature values from Observation Sheet N-11. (1.5) Complete the following table relating the temperature to reaction rate. (1.0) 1. Plot ln(k) vs. 1/T (K1) using Google Sheets or some other computer spreadsheet software. Your graph should include a best-fit line from software-calculated linear regression analysis. Include the data from Exp M Run 1 as a data point as well. Attach the plot to your lab report. (1.0) 2. In the space below, write the linear equation (of the form y=mx+b ) for the best-fit line for the data plotted above. Be sure to include units, even if they are absent in the equation as it appears in your software. Clearly identify and label both the slope and the y-intercept portions of this equation. (1.0) 3. Using the value of the slope of the best fit line, calculate the activation energy (E0) for the reaction of CV and OH:(1.5) 4. Using the value of the y-intercept of the best fit line for the graph, calculate the preexponential factor (A) for the reaction of CV and OH:. (1.0) 5. Calculate the value of k that should be obtained from a run performed at 5C Show your calculations. (1.5) End of Report