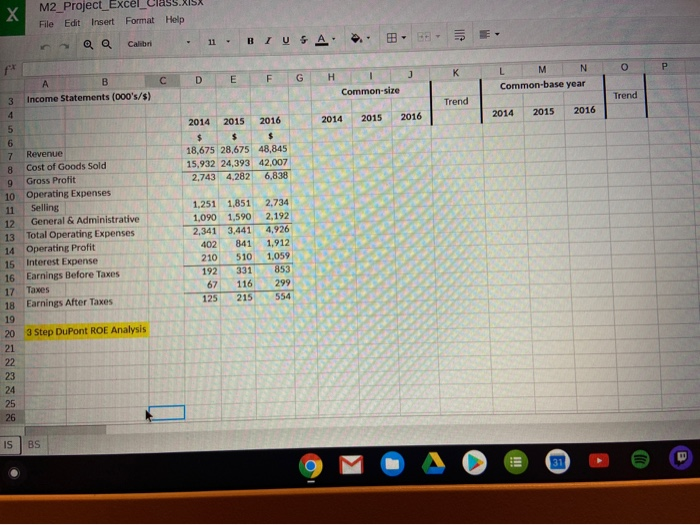
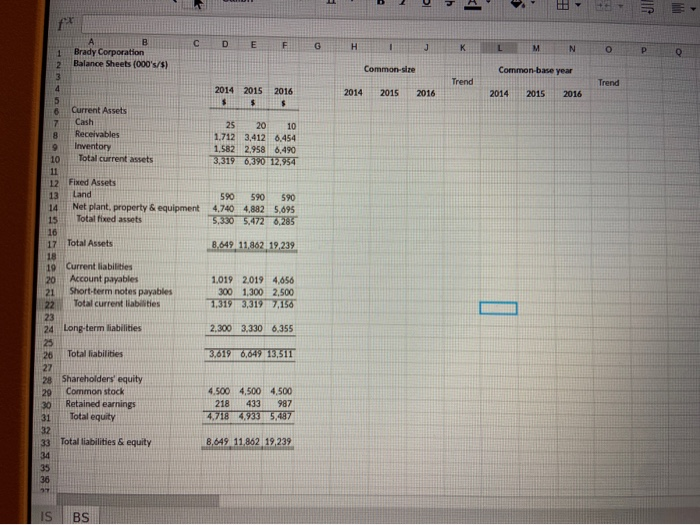
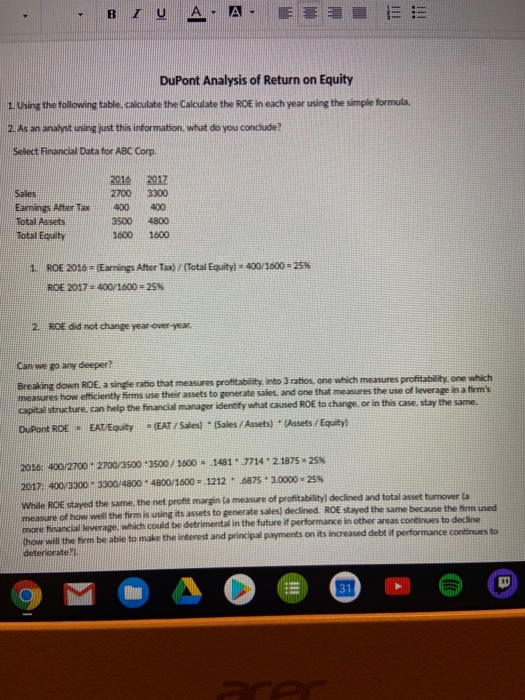
M2_Project_Excel File Edit Insert Format Help Q Calibri 11 BI USA O P J D F G E H A B Income Statements (000's/s) L M N Common-base year Common-size Trend Trend 3 4 2014 2015 2016 2014 2016 2015 2014 2015 2016 $ $ 18,675 28,675 48,845 15,932 24,393 42,007 2,743 4,282 6,838 5 6 7 Revenue 8 Cost of Goods Sold 9 Gross Profit 10 Operating Expenses 11 Selling 12 General & Administrative 13 Total Operating Expenses 14 Operating Profit 15 Interest Expense 16 Earnings Before Taxes 17 Taxes 18 Earnings After Taxes 19 20 3 Step DuPont ROE Analysis 21 22 23 24 25 26 1.251 1,851 1,090 1,590 341 3,441 402 841 210 510 192 67 116 125 215 2.734 2,192 4,926 1,912 1,059 853 299 554 IS BS 31 b 1 ME D E F G H J K M 1 N O Brady Corporation Balance Sheets (000's/$) P 0 Common-size Common-base year Trend Trend 2014 2015 2016 2014 2015 2016 S $ $ 2014 2015 2016 25 20 10 1.712 3,412 6.454 1,582 2.958 6,490 3.319 6.390 12,954 590 590 590 4,740 4,882 5,695 5,330 5.472 6,285 8,649 11,862 19,239 Current Assets 7 Cash 8 Receivables 9 Inventory 10 Total current assets 11 12 Fixed Assets 13 Land 14 Net plant, property & equipment 15 Totalfixed assets 16 17 Total Assets 18 19 Current liabilities 20 Account payables 21 Short-term notes payables 22 Total current liabilities 23 24 Long-term liabilities 25 26 Total liabilities 27 28 Shareholders' equity 29 Common stock 30 Retained earnings 31 Total equity 32 33 Total liabilities & equity 34 35 36 1.019 2019 4.656 300 1,300 2.500 1.319 3,319 7.156 I 2.300 3.330 6.355 3,6190,649 13,511 4.500 4,500 4,500 218 433 987 4,718 4.933 5,487 8,649 11.862 19.239 IS BS BIU A LE TIT DuPont Analysis of Return on Equity 1. Using the following table.calculate the calculate the ROE in each year using the simple formula. 2. As an analyst using just this information, what do you conclude? Select Financial Data for ABC Corp. 2014 2700 400 3500 1600 2017 3300 400 Sales Earnings After Tax Total Assets Total Equity 4800 1600 1 ROE 2016 = (Earnings After Tax)/(Total Equity) = 400/1600 = 25$ ROE 2017 400/1600 = 25$ 2. ROE did not change year-over-year Can we go any deeper? Breaking down ROE, a single ratio that measures profitability, into 3 ratios, one which measures profitability, one which measures how efficiently firms use their assets to generate sales and one that measures the use of leverage in a firm's capital structure, can help the financial manager identify what caused ROE to change or in this case, stay the same. DuPont ROE EAT/Equity = (EAT / Sales! Sales / Assets) Assets / Equity 2016: 400/2700-2700/3500 3500/1600 = 1481 771421875 - 25 2017: 400/3300 3300/4800 4800/1600 = 1212 6875 3.0000 - 25 While ROE stayed the same, the net profit margina measure of profitability declined and total asset turnover la measure of how well the firm is using its assets to generate sales) declined. ROE stayed the same because the firm used more financial leverage, which could be detrimental in the future of performance in other areas continues to decline (how will the tem be able to make the interest and principal payments on its increased debt it performance continues to deteriorate? 31 PPT


