Macys & JC Penney - Questions
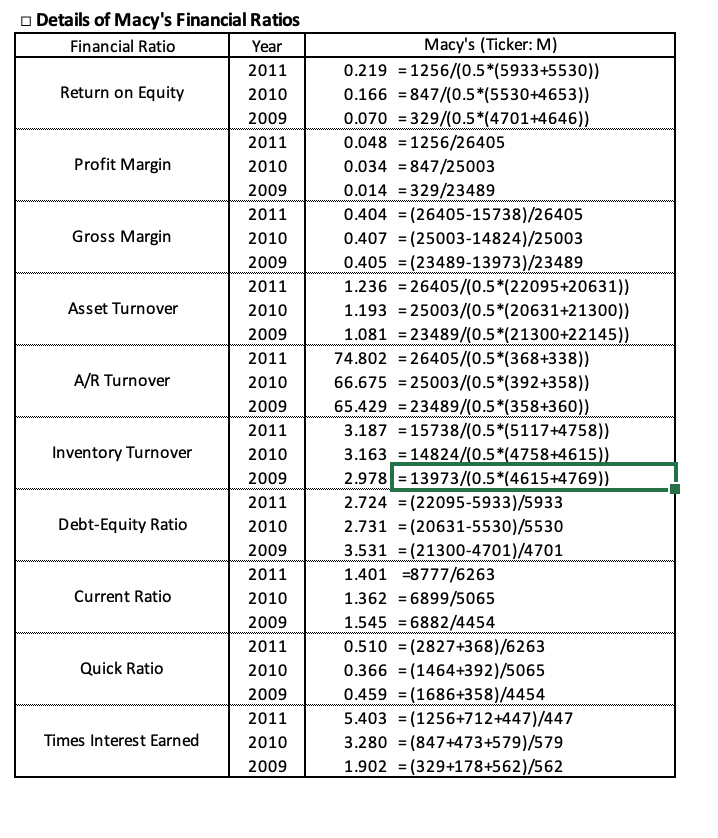
- Using the guidelines provided below, compute financial ratios for fiscal years 2009, 2010, and 2011 (ending on January 30, 2010, January 30, 2011, and January 2012, respectively).
- Based on past profitability ratios, which firm is likely to be more profitable in the future and why? Discuss in detail. Use the component ratios of return on equity to explain the reasons for the difference in profitability across the two firms. In other words, is profit margin, asset turnover, and/or financial leverage responsible for the difference in profitability?
- Based on the risk ratios, which firm is likely to be more risky in the future and why?
- Based on the information contained in the Statement of Cash Flows, which firm faces greater liquidity risk? Discuss in detail by considering separately cash flows from operations, investment and financing activities, and the major components contained within each of these activities.
- Use the information in notes 17 and 20 of the 2011 fiscal year financial statements of JC Penney for evaluating its risk.
- As a potential investor, what other information you would be useful to you, and where is it available?
Guidelines to compute ratios for JC Penney & Macys
- Return on Equity = Net income/Avg. Total Equity
- Profit Margin = Net income/Sales
- Gross Margin = (Net sales Cost of Sales)/Net Sales
- Total Asset Turnover = Net sales/Avg. Total Assets
- Accounts Receivable Turnover = Sales/Avg. Accounts Receivable
- Inventory Turnover Ratio = Cost of Goods Sold/Avg. Inventory
- Debt to Equity Ratio = Total Liabilities/Total Equity
- Total Liabilities = Total Assets Total Equity
- Current Ratio = Current Assets/Current Liabilities
- Quick Ratio = (Cash + Marketable Securities + Accounts Receivable)/Current Liabilities
- Times Interest Earned = Income before Interest and Taxes/Interest Expense
Note: JC Penney does not provide a separate amount for Accounts Receivables (it is included in Cash in banks and in transit). You may just indicate missing data for Accounts Receivable Turnover ratio.
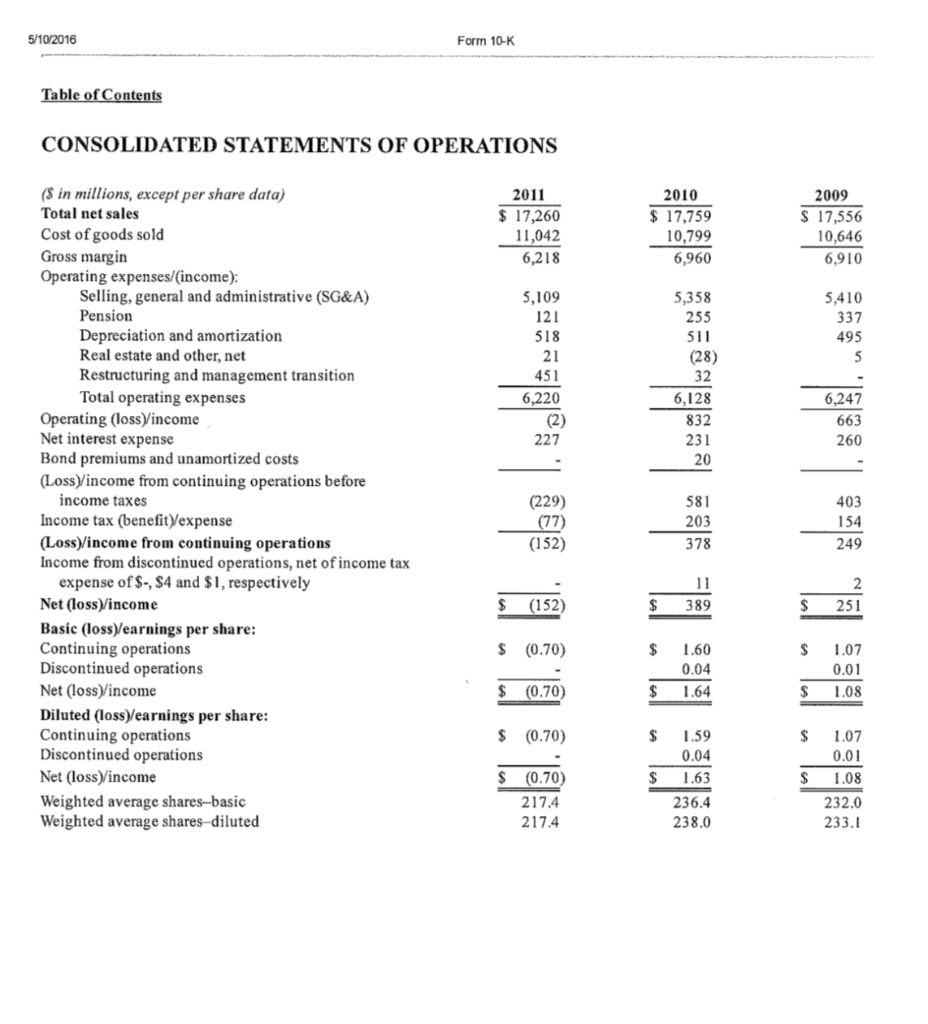
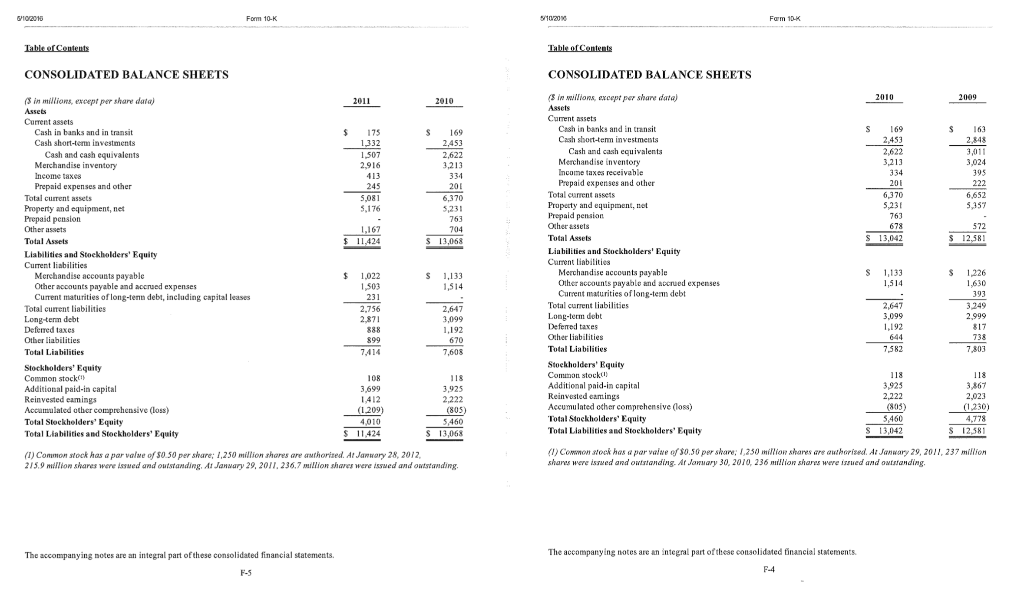
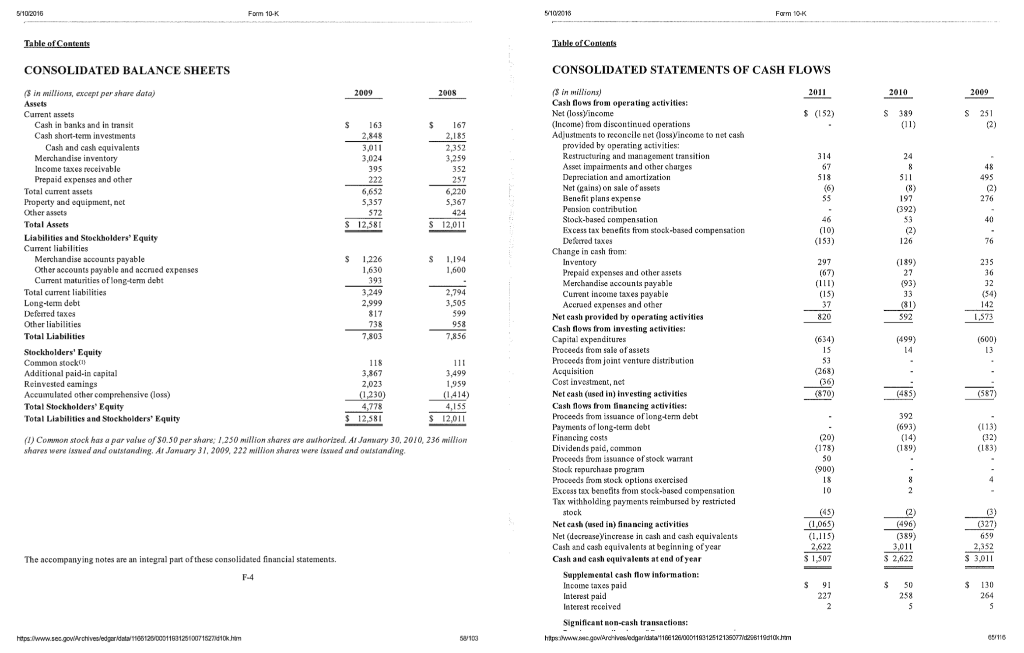
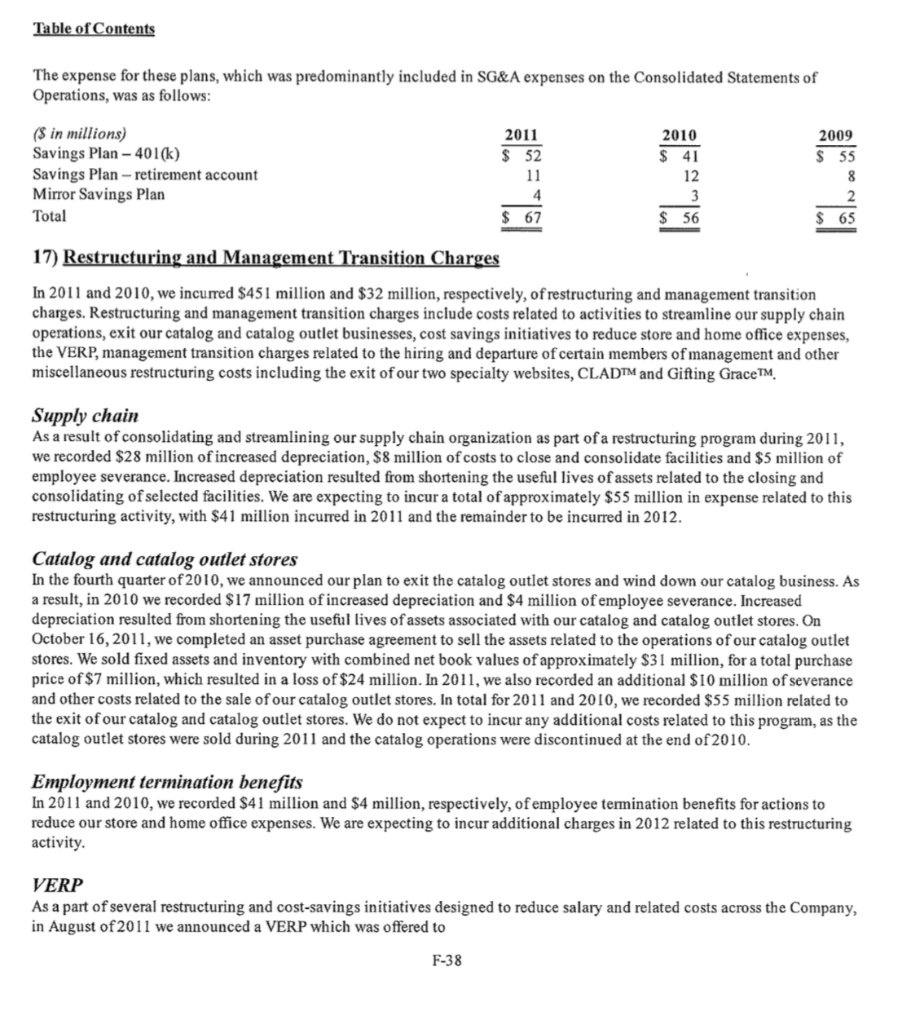
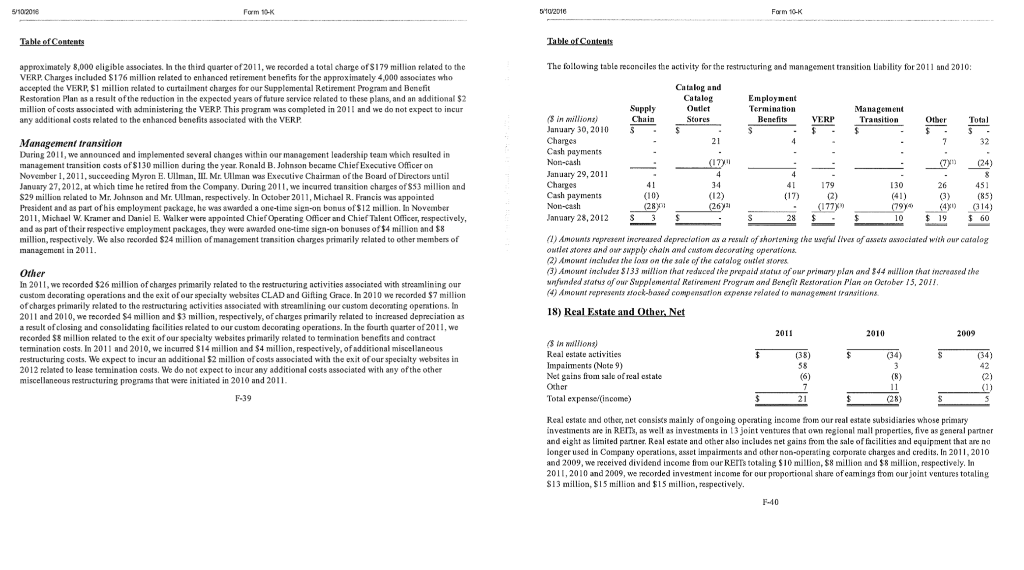
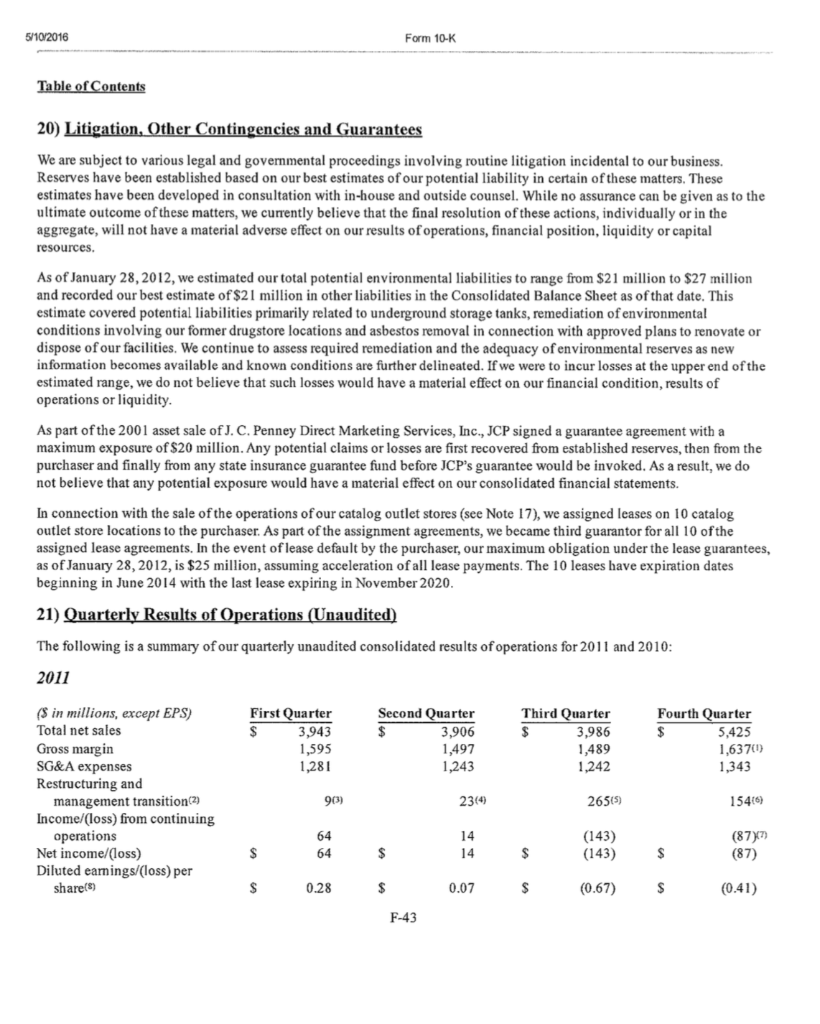
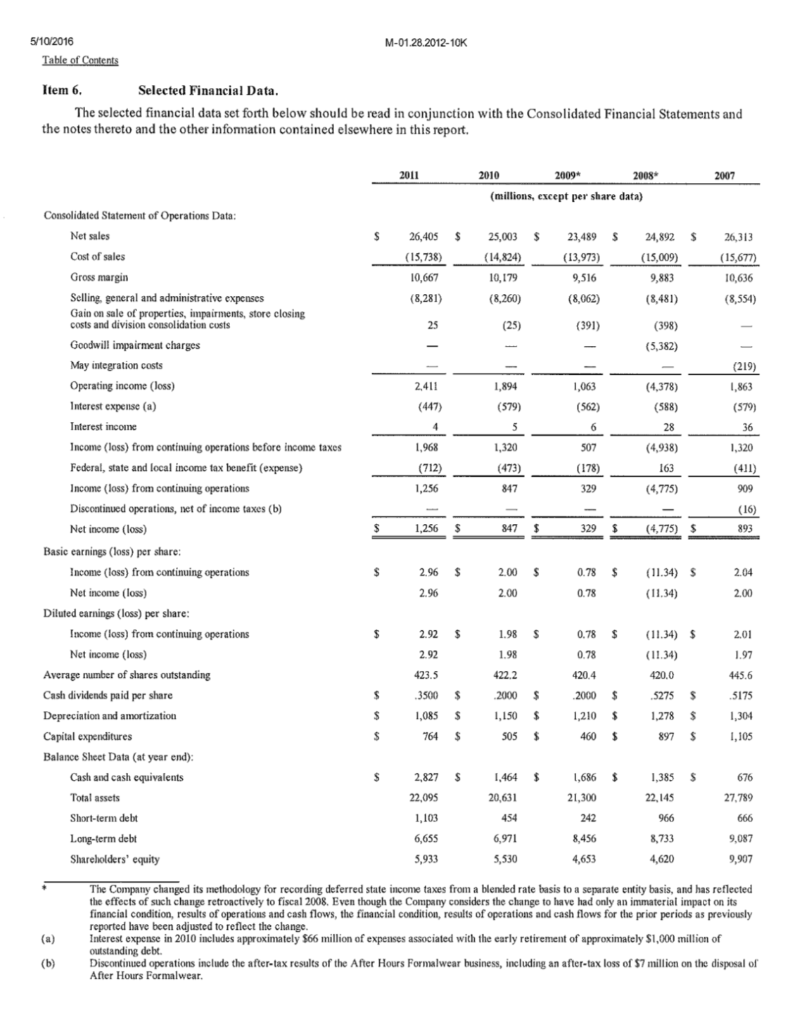

5/10/2016 Form 10-K Table of Contents CONSOLIDATED STATEMENTS OF OPERATIONS (S in millions, except per share data) 2011 2010 2009 Total net sales $ 17,556 $ 17,759 17,260 11,042 Cost of goods sold Gross margin Operating expenses/(income) Selling, general and administrative (SG&A) Pension 10,799 10,646 6,218 6,960 6,910 5,109 121 5,358 5,410 255 337 Depreciation and amortization Real estate and other, net Restructuring and management transition Total operating expenses Operating (loss)Yincome Net interest expense Bond premiums and unamortized costs (Loss income from continuing operations before income taxes Income tax (benefit)/expense (Loss)/income from continuing operations Income from discontinued operations, net of income tax expense of $, S4 and $1, respectively 518 511 495 21 (28) 451 32 6,220 6,128 6,247 (2) 832 663 227 231 260 20 (229) (77) 581 403 203 154 (152) 378 249 11 2 Net (loss)/income (152) 389 251 Basic (loss/earnings per share: Continuing operations Discontinued operations Net (loss)/income Diluted (loss)/earnings per share Continuing operations Discontinued operations Net (loss/income (0.70) 1.60 .07 0.04 0.01 (0.70) 1.64 1.08 $ (0.70) 1.59 1.07 0.01 0.04 (0.70) S 1.63 1.08 Weighted average shares-basic Weighted average shares-diluted 217.4 236.4 232.0 217.4 238.0 233. 51020 6/10/2010 Eorm 10-K Farm 10-K Table of Contents Table of Contents CONSOLIDATED BALANCE SHEETS CONSOLIDATED BALANCE SHEETS 2010 (8 in illions, except per share data) 2009 millions, except per share data) Assets 2010 2011 Assets Curent assets Current assets 169 163 S Cash short-tem investmente 2.453 845 1 3 2453 Cash and cash equivalents 2.622 2.01 Cash and cash equivalents 1.507 2.622 3. Merchandise inventory 2,916 3,213 Incame taxes receivable Prepaid expenses and other 20 222 Prepaid expenses and other 245 201 Total current assets 5,081 6,370 S221 quipment, net 3,176 Prepaid pension. Prepaid pension 763 763 Other assets ,167 704 S 12.581 11.042 $ 11,424 S 13,068 Total Agoly Liabilities and Stockholders' Equity Liabilities and Stockholders' Equity Curent liabilities Current liabilities ounts pavable 1.133 226 Cu accounts navable and acensed expenses 503 1 S14 Other acpounts payable and accrued expenses 1.514 1636 Curent maturities of long-term debt 393 Curent maturities of long-temn debt, including capital leases 231 To abilities abilities Long-term debt 3099 oge Deferred taxes Defemed taxes 1,192 817 888 1,192 Otber liabilities 7487 Total Liabilities 907 Stockholders' Equity Common stock Stockholders' Equity Common stock dldaal paid-in capital 118 108 118 capital Reinvested eamings Accumulated other comprehensive (loss) 2.222 021 (805) (1230) Accamulated other comprehensive (loss) (1209) 4,010 (805) Total Stockholders' Equity 5460 nbilitis and Stockholders' Equity S 13.042 S 12.581 S 13.068 $11424 Total Liabilities and Stockholders' Equity 201, 237 million (1) Common stock has a par value of S0.50 per share; 1,250 million shares are authorized. At January 28, 2012, 215.9 million shares were issued and outstanding. At January 29, 2011, 236.7 million shares were issued and outstanding. shares were is tued and outstandig dtJanuary 30 2010 236 milliar sheres were ircued and outrtandins g The accompanying notes are integral part ofthese consolidated financial statements integral part of these consolidated financial statements The accompanving notes are 510/2016 Fom 10-K3 510/2018 Fam 10-10 Table of Contents Table of Contents CONSOLIDATED STATEMENTS OF CASH FLOWS CONSOLIDATED BALANCE SHEETS (S in millions Cash flows from operating activities: 2011 2010 2009 (S in millions, except per share data) 2009 2008 Assets S 25 $ (152) S 389 Cur (ncome) from discontinued operations Cash in banks and in transit S 161 S 167 Adjustments to reconcile net loss)Vincome to net cash Cash short-tem investments 2,848 2,185 uivalents Manchandiae inaom Restuturing and managementt transition 314 Asset impairments and other charges 67 Income taxes receivable 399 357 Prepasd expenses and other To Net (eains)on sale of assets (6) 55 5367 Benefit plans expense 197 276 Property and equipment, net 5357 ,35 04her assets Stork.based campen sation $ 12.58 S 12,011 Excess tax benefits fiom stock-based compensation (10) Liabilities and Stockholders' Equity Current liabilities (153) 126 Change in eash fom: Inventory 297 (189) 235 349ut navable and accrmed expenses 1630 penses and other assets Marcbandise accounts payable Curent inoome taxes payable Current maturities of long-tem deht 93 (1D) (93) 12 iabilities (15) (54 Defered taxes 812 499 Net eash provided by operating activities Cash flows from investing activities 820 Other liabilities es (500) (499 634) Proceeds from sale of assets Stockholders' Equity Proceeds from joint venture distribution 53 Common stocko 118 111 Additional paid-in capital Cot inveatment, net Net eash (used in) investing activities Cash flows from inancing activities G6) (587 870 (485 Accumulated other comprehensive (loss) (1,230) (414) Total Stockholders' Equity 4,778 4,155 ng-term debt $ 12,58 $ 12,011 392 Total Liabilities and Stockholders' Equity Pavments of long-term debt (693) (113) (1) Common stock has a par value of $0.50 per share; 1,250 million shares are authorized.. shares were isswed and outstanding.. Financing costs January 30, 2010, 236 million January 31, 2009, 222 miliion shares were isswed and outstanding (189) (183) ommon Proceeds from issuance of stock warant 50 Stock repurchaao prognam (900) Ees tax benefits from stock-based compensation Tax withholding payments reimbursed by restricted stock 45) (used in) financing activities Net (decruaseyincrease in cash and cash equivalents Cash and cash equivalents at beginning of year Cash and cash equivalents at end of year N (389 650 2,622 3,011 2.352 integral part of these consolidated financial statements. $ 1,507 S 3,011 S2,622 The accompanying notes are flow information: F-4 ina d s 91 $ 130 50 227 258 264 Interest paid Interest received Significant non-cash transactions: W101 htpswwwgowrdhvesedgaridata1108126/0001193125121307mse11910mn tps:www.sec.aowrchivesledaor/data/1108120/000118312510071527410k hm Table of Contents The expense for these plans, which was predominantly included in SG&A expenses on the Consolidated Statements of Operations, was as follows: (S in millions Savings Plan-401(k) Savings Plan-retirement account Mirror Savings Plan 2011 2010 2009 $ 52 $ 41 $ 55 11 12 8 4 3 2 Total $ 56 $ 65 $67 17) Restructuring and Management Transition Charges In 2011 and 2010, we incurred $451 million and $32 million, respectively, of restructuring and management transition charges. Restructuring and management transition charges include costs related to activities to streamline our supply chain operations, exit our catalog and catalog outlet businesses, cost savings initiatives to reduce store and home office expenses the VERP, management transition charges related to the hiring and departure of certain members ofmanagement and other miscellaneous restructuring costs including the exit ofour two specialty websites, CLADTM and Gifting GraceTm Supply chain As a result of consolidating and streamlining our supply chain organization as part ofa restructuring program during 2011, we recorded $28 million of increased depreciation, $8 million of costs to close and consolidate facilities and $5 million of employee severance. Increased depreciation resulted from shortening the useful lives ofassets related to the closing and consolidating of selected facilities. We are expecting to incur a total ofapproximately $55 million in expense related to this restructuring activity, with $41 million incurred in 2011 and the remainder to be incurred in 2012. Catalog and catalog outlet stores In the fourth quarter of 20 10, we announced our plan to exit the catalog outlet stores and wind down our catalog business. As result, in 2010 we recorded $17 million of increased depreciation and $4 million ofemployee severance. Increased depreciation resulted from shortening the useful lives ofassets associated with our catalog and catalog outlet stores. On October 16, 2011, we completed an asset purchase agreement to sell the assets related to the operations ofour catalog outlet stores. We sold fixed assets and inventory with combined net book values of approximately $31 million, for a total purchase price of $7 million, which resulted in a loss of $24 million. In 2011, we also recorded an additional $10 million of severance and other costs related to the sale ofour catalog outlet stores. In total for 2011 and 2010, we recorded $55 million related to the exit of our catalog and catalog outlet stores. We do not expect to incur any additional costs related to this program, as the catalog outlet stores were sold during 2011 and the catalog operations were discontinued at the end of 2010. Employment termination benefits In 2011 and 2010, we recorded $41 million and $4 million, respectively, ofemployee termination benefits for actions to reduce our store and home office expenses. We are expecting to incur additional charges in 2012 related to this restructuring activity VERP As a part of several restructuring and cost-savings initiatives designed to reduce salary and related costs across the Company, in August of 2011 we announced a VERP which was offered to F-38 5/10/20 Form 10-9 510/2016 Fam 10-10 Table of Contents Table of Contents The following table recanciles the activity for e restructuring and manngement transition liability for 2011 and 2010: th VERP Charzes included S176 million related to enhanced retirement benefits for the approximately 4.0000 associates who rour Supplemental Retirement Program and Benefit Catalog and accepted the VERP, $1 million related to curtailment charges million of costs associated with administering the VERP This pmeram wns completed in 2011 and wr do not expect to incur any additional costs related to the enhanced benefits associated with the VERP Terminatton Supply Outlet Management Transition (S in millions) , 2010 Chain Stores Benefits VERP Other nta Chames 21 32 Management transition Daring 2011, we announced and implemented several changes with in nanagement traiion casts ofsT30 million during the year. Konald B.Johnson became Chief Executive Officer on Cash payments r management leadership team which resulted in (17y (24. January 29, 2011 January 27,2012, at which time he retired from the Company. Daring 2011, we incarred transition charges of $53 million and $29 million related to Mr. Johnson and Mr. Ullman, respectively. In October 2011, Michael R. Francis was appointed Charges 41 34 179 30 451 ents Nocb (17) nova (177X) mbe $ 19 $ 60 January 28, 2012 2011, Michael W. Kramer and Daniel E. Walker were appointed Chief Operating Officer and Chief Talent Oficer, respectively, 28 10 )Amounts represent increared depreciotion as a result of shortening the useful lives of assets associated with our catalog outlet stores and owr supply chain and custom decorating operation. million of management transition charges primarily rel sof management in 2011 ur primary plan and $44 million that increased the other anfunded status of our Supplemental Retirement Program and Benefit Restoration Plan on October 15, 2011 (4) Amount represents stock-based compensation expense related to management transitions. In 2011, we recorded $26 million of charges primarily related to the restructuring activities associated with streamlining our custom decorating operations and the exit of our specialty websites CLAD and Gifting Grace. In 2010 we recorded $7 million 18) Real Estate and Other, Net 2011 and 2010. we recerded $4 million and $3 million, respectively. of charres primarily related to increased depreciation as a result of closing and consolidating facilities related to our custom decorating operations. In the fourth quarter of 2011, we 2011 2010 2009 temination costs. In 2011 and 2010, we incured S14 million and $4 million. respectively, of additional miscellanequs S in milliong) (34) 34 restructuring costs. We expect to incur an additional $2 million of costs associated with the exit of our specialty websites in itional costs associated with any ofthe other Imnsiments (Note 9) miscallanecus restaucturing pmeams that were initiated in 2010 and 2011. Net gains frun le of real estate (61 (8 (2) 1 F-39 expense(income) investments are in BEITS as wel as investments in 13 inirt venturea that own reaionnl mall pronerties five as general pafner and eight as limited partner. Real estate and other also includes net gains from the sale of facilities and equipment that are no ,2010 and 2009. we received dividend income ftom our RETs totaling $10 millicn. $8 million and $8 million, respcctively 2011.2010 and 2009, we recorded investment income for our pmacrtional share of carminga from our ioint ventures totaling S13 million, SI5 million and $15 million, respectively EMC 5/10/2016 Form 10-K Table of Contents 20) Litigation, Other Contingencies and Guarantees We are subject to various legal and governmental proceedings involving routine litigation incidental to our business. Reserves have been established based on our best estimates of our potential liability in certain of these matters. These estimates have been developed in consultation with in-house and outside counsel. While no assurance can be given as to the ultimate outcome of these matters, we currently believe that the final resolution ofthese actions, individually or in the aggregate, will not have a material adverse effect on our results of operations, financial position, liquidity or capital resources. As of January 28, 2012, we estimated our total potential environmental liabilities to range from $21 million to $27 million and recorded our best estimate of $2 1 million in other liabilities in the Consolidated Balance Sheet as of that date, This estimate covered potential liabilities primarily related to underground storage tanks, remediation of environmental conditions involving our former drugstore locations and asbestos removal in connection with approved plans to renovate or dispose ofour facilities. We continue to assess required remediation and the adequacy ofenvironmental reserves as new infomation becomes available and known conditions are further delineated. If we were to incur losses at the upper end ofthe estimated range, we do not believe that such losses would have a material effect on our financial condition, results of operations or liquidity As part of the 2001 asset sale of J. C. Penney Direct Marketing Services, Inc., JCP signed a guarantee agreement with a maximum exposure of $20 million. Any potential claims or losses are first recovered from established reserves, then from the purchaser and finally from any state insurance guarantee fund before JCP's guarantee would be invoked. As a result, we do not believe that any potential exposure would have a material effect on our consolidated financial statements. stablishe *** In connection with the sale ofthe operations ofour catalog outlet stores (see Note 17), we assigned leases on 10 catalog outlet store locations to the purchaser. As part of the assignment agreements, we became third guarantor for all 10 ofthe assigned lease agreements. In the event oflease default by the purchaser, our maximum obligation under the lease guarantees, as of January 28, 2012, is $25 million, assuming acceleration of all lease payments. The 10 leases have expiration dates beginning in June 20 14 with the last lease expiring in November 2020 . 21) Quarterly Results of Operations (Unaudited) The following is a summary of our quarterly unaudited consolidated results of operations for 2011 and 2010: 2011 (S in millions, except EPS) First Quarter 3,943 1,595 Second Quarter 3,906 1,497 1,243 Third Quarter Fourth Quarter Total net sales S $ 3,986 5,425 1,637 1,343 Gross margin SG&A expenses Restructuring and management transition(2) Income/(loss) from continuing operations Net income/loss) Diluted earmings/(loss) per share(s) 1,489 1,281 1,242 93) 23(4) 265(5) 1546) 64 14 (143) (143) (87X7 (87) S 64 14 S 0.28 $ 0.07 (0.67) (0.41) F-43 Details of Macy's Financial Ratios Macy's (Ticker: M) Financial Ratio Year 0.219 1256/(0.5*(5933+5530)) 0.166 =847/0.5*(5530+4653)) 0.070 329/(0.5*(4701+4646)) 2011 Return on Equity 2010 2009 0.048 1256/26405 0.034 847/25003 0.014 329/23489 0.404 (26405-15738)/26405 0.407 (25003-14824)/25003 2011 Profit Margin 2010 2009 2011 Gross Margin 2010 0.405 289-13973)/23489 1.236 26405/(0.5*(22095+20631)) 1.193 25003/(0.5*(20631+21300)) 2009 2011 Asset Turnover 2010 1.081 23489/(0.5*(21300+22145)) 74.802 26405/(0.5*(368+338)) 66.675 25003/(0.5*(392+358) 65.429 289/(0.5*(358+360)) 3.187 15738/(0.5*(5117+4758)) 3.163=14824/(0.5*(4758+4615)) 2.97813973/(0.5*(4615+4769)) 2009 2011 A/R Turnover 2010 2009 2011 Inventory Turnover 2010 2009 2.724 (22095-5933)/5933 2.731 (20631-5530)/5530 2011 Debt-Equity Ratio 2010 3.531 2130-4701)/4701 1.401 8777/6263 1.362 6899/5065 2009 2011 Current Ratio 2010 1.545 6882/4454 0.510 (2827+368)/6263 0.366 (1464+392)/5065 0.459 =(1686+358)/4454 5.403 (1256+712+447)/447 2009 2011 Quick Ratio 2010 2009 2011 Times Interest Earned 3.280 (847+473+579)/579 2010 1.902 (329+178+562)/562 2009 5/10/2016 M-01.28.2012-10K Table of Contents Selected Financial Data Item 6, The selected financial data set forth below should be read in conjunction with the Consolidated Financial Statements and the notes thereto and the other infomation contained elsewhere in this report. 2011 2010 2009 2007 2008 (millions, except per share data) Consolidated Statement of Operations Data: Net sales S 26,405 S 25,003 23,489 S 24,892 26,313 Cost of sales (15.738) (14,824) (13,973) (15.009) (15,677) Gross margin 10.667 10,179 9.516 9,883 10,636 Selling, general and administrative expenses (8.281) (8,260) (8,062) (8,481) (8,554) Gain on sale costs and division consolidation custs properties, impairments, store closing 25 (25) (391) (398) Goodwill impairment charges (5,382) May integration costs (219) Operating income (loss) 2.411 1,894 1,063 (4,378) L.863 Interest expense (a) (447) (562) (579) (588) (579) Interest incone 28 36 6 Income (loss) from continuing operations before income taxes 1,968 1.320 507 (4,938) 1.320 Federal, state and local income tax benefit (expense) (712) (473) (178) 163 (411) Income (loss) from continuing operations 1,256 847 329 (4,775) 909 Discontinued operations, net of income taxes (b) (16) (4,775) $ Net income (loss) S 1.256 S 847 329 893 Basic earnings (loss) per share: Income (loss) from continuing operations $ $ 2.96 2.00 0.78 (11.34) S 2.04 Net income (loss) 2.96 2.00 0.78 (11.34) 2.00 Diluted earnings (loss) per share: Income (loss) from continuing operations 2.9 1.98 S 0.78 (11.34) 2.01 Net income (loss) 2.92 1.98 0.78 (1.34) 1.97 420,0 423.5 Average number of shares outstanding 422.2 420.4 445.6 Cash dividends paid per share 3500 2000 2000 527 5175 L08 Depreciation and amortization 1,150 1210 1.27 1.304 Capital expenditures 764 505 460 897 ,105 Balance Sheet Data (at year end): Cash and cash equivalents S 2.82 L.464 1,686 1.38 676 Total assets 22,095 20,631 21,300 22.145 27,789 1.103 454 Short-term debt 242 966 666 Long-term debt 6,655 6,971 8.456 8,733 9,087 Shareholders' equity 5,933 5,530 4,653 4,620 9,907 y changed its methodology for re The the effects of such change retroactively to fiscal 2008, Even though the Company considers the change to have had only an immaterial impact on its financial condition, results of operations and cash flows, the financial condition, results of operations and cash flows for the prior periods as previously reported have been adjusted to reflect the change. kErein debt deferred state income taxes from a blended rate basis to basis, and has reflected in 2010 includes approximately $66 million of expenses associated with the early retirement approximately $1,000 million of (a) Discontinued operations include the after-tax results of the After Hours Formalwear business, including an after-tax loss of $7 million on the disposal of (b) After Hours Formalwear. S10201 5102016 M-01.28.2012-100 Form 10-K Iabis of Contat Table of Contents MACY'S, INC. CONSOLIDATED BALANCE SHEETS (illions) MACY'S, INC. CONSOLIDAT CE SHEETS (millions) Jauary 28, 2012 Jaary 25, 2011 ASSETS January 29, 211 Current Assets January 3 2 ASSETS Cash and cash equivalents 2827 S 1464 Current Ascete Receivables 368 338 Cash and cash equivalents L686 1,464 Merchandise inventories 5.117 4* Receivables 33 8 39a Pre r current assets Prepaid expenses and other cument assets 28 221 Total Curent Asgets 8,777 6,899 Total Current Assets 6.899 6,882 Property and Equipment-net 8420 8.813 8,813 Property and Equipment-net 9.507 Goodwill 3.743 3,743 Goodwill 3,743 ngible Assets-net , 743 sS7 ... gible Assets-net Total Assets 22.095 S 20.631 Other Assets 535 490 20,631 21.300 LIABILITIES AND SHAREHOLDERS EQUITY Tetal Assets LIABILITIES AND SHAREHOLDERS' EQUITY Current Liabilities: Cur Short-term debt 1.103 S 454 Short-tean debt Merchandise accounts payable 45 242 1.421 .312 Accounts navahle and accraed liabilities 2 525 788 able and acerued liabilities Income taxes Defered income taxes Total Curent Liabilities 371 182 Income taxes 364 214 Defered income taxes 408 409 Total Current Liabilities 6,263 4,991 Long-Tem Deferred Income Taxes 1245 1.132 Deferred Inc Taxes L141 1200 2,103 1,939 Other Liabilities 1.820 599 Other Liabilities Shareholders Equity Shareholdens' Equity: 420.8 shares outstanding) Common stock (414.2 and 423.3 shares outstanding) ddinional naidein canital 5.696 689 capital 408 5.696 Accumalated equity Treasury stock Accum Total Shareholders' Equity Total Liabilities 2,990 (2.431) 2.227 Accumulated equity 4.015 2.990 (2,515) 3 ) (2434) (2431) Treasury stock ve loss (730 Accumulated other comprehensive loss Total Shareholders' Equity (1,061) S 933 5,530 Shareholders' Equity 20.631 21.300 22.095 S 20.63 Total Liabilitios and Shareholders' Equity $ The accompanying notes are an integral part ofthese Conssolidated Financial Statementts integrnl part ofthese Consolidated Financial Statements, The accompanying notes are M-01.28.2012-10es S102016 6/10/2016 Errm 10 K e of Contents MACY'S, INC. MACY'S, INC CONSOLIDATED BALANCE SHEETS CONSOLIDATED ST S OF CASH FLOWS (millions) (millions) January 31, 20 Jaasary 3, 2010 ASSETS 2014 Current Assets Cach flows from operving ativities: hequivalents 1,6 Ne income L256 $47 329 Roceivahles As vidnd hy onratng activaies me to net cash Merchandise inventories 4,615 1.769 Sapp Total Curent Assets enses. Gan cn sale of properics, impaiments, store cksing 6 882 6.740 (25) 24 391 9.507 10,442 Property and Equipment-net Depreciion and anoetization Stock-based copensation expense LI50 211 Goodwill 3.743 743 70 66 Amotivaticn ofravncing costs and nremium on acouired debt Other Intangible Assets-net 678 719 (15) (23 (25) Chnges Other Assets s 21 300 7 otal Assets 22 vables (37) (51) (Incres) doreise i merdhdise invenkris LIABILITIES AND SHAREHOLDERS (359) (143) 154 EQUITY Current Liabilities (Increase) derense in prepaid expeses and other curent assets (991 (10) 24: 966 (Increaso) docre in other assets not sepratoly idetified Macbandise accounts payable 1.312 287 143 25 Accounts payable and accrued liabilities 2,626 2.628 Increase (decrease) it aooounts onable and ascrued lisbiies no sepely idtifiod 00 (45 201 Deferred income taxes 222 04 4454 Total Current Liabilities 5.126 Long-Term Debt 8,456 8733 Drzuse in other labilities not seradly identified (757 1 506 (384) (372) 1,119 Deferred Income Taxes 1,0 Net cash provided by operating activities n93 750 2,621 2,521 Cash lows fr investing activics Sharcholders" Equity: (555) (355) Common stock (420.8 and 420.1 shares outstanding) Cid dpmcnt apita A ulated eaity 2274 Dispasition of property and equipment Proceeds frum insuranoe clas Oder, net 14 14 60 008 Treasury stock Acr (2.514) (2.544) 6 21 nsive loss 27 (40) (3) l hrboalders Fauity 4701 646 Nt geh (617) (377 (463) 1sed by investieg activities 21,300 22,145 Total Liabilities and Shareholders' Equity Cash flows rom Dencine actlvitie Deise 800 Financieg costs (20) L245 Debt id (454) (966) Daidends paid (148) (84) (84) outstanding checks The accompanving notes are an integral nart of these Consolidated Financial Statements. aiaitka of tmasury sock (S02) 41 F-S Issarce of common siock 167 43 Net ab used by finncng activities 113 1,263 11,072x Net increase (decrease) ia cesh and cash equivalents 1,363 (222) JUL 2827 L464 L6e Cash atd ueh eauivalents end of perkd Supplanental ads low informetion 5/10/2016 Form 10-K Table of Contents CONSOLIDATED STATEMENTS OF OPERATIONS (S in millions, except per share data) 2011 2010 2009 Total net sales $ 17,556 $ 17,759 17,260 11,042 Cost of goods sold Gross margin Operating expenses/(income) Selling, general and administrative (SG&A) Pension 10,799 10,646 6,218 6,960 6,910 5,109 121 5,358 5,410 255 337 Depreciation and amortization Real estate and other, net Restructuring and management transition Total operating expenses Operating (loss)Yincome Net interest expense Bond premiums and unamortized costs (Loss income from continuing operations before income taxes Income tax (benefit)/expense (Loss)/income from continuing operations Income from discontinued operations, net of income tax expense of $, S4 and $1, respectively 518 511 495 21 (28) 451 32 6,220 6,128 6,247 (2) 832 663 227 231 260 20 (229) (77) 581 403 203 154 (152) 378 249 11 2 Net (loss)/income (152) 389 251 Basic (loss/earnings per share: Continuing operations Discontinued operations Net (loss)/income Diluted (loss)/earnings per share Continuing operations Discontinued operations Net (loss/income (0.70) 1.60 .07 0.04 0.01 (0.70) 1.64 1.08 $ (0.70) 1.59 1.07 0.01 0.04 (0.70) S 1.63 1.08 Weighted average shares-basic Weighted average shares-diluted 217.4 236.4 232.0 217.4 238.0 233. 51020 6/10/2010 Eorm 10-K Farm 10-K Table of Contents Table of Contents CONSOLIDATED BALANCE SHEETS CONSOLIDATED BALANCE SHEETS 2010 (8 in illions, except per share data) 2009 millions, except per share data) Assets 2010 2011 Assets Curent assets Current assets 169 163 S Cash short-tem investmente 2.453 845 1 3 2453 Cash and cash equivalents 2.622 2.01 Cash and cash equivalents 1.507 2.622 3. Merchandise inventory 2,916 3,213 Incame taxes receivable Prepaid expenses and other 20 222 Prepaid expenses and other 245 201 Total current assets 5,081 6,370 S221 quipment, net 3,176 Prepaid pension. Prepaid pension 763 763 Other assets ,167 704 S 12.581 11.042 $ 11,424 S 13,068 Total Agoly Liabilities and Stockholders' Equity Liabilities and Stockholders' Equity Curent liabilities Current liabilities ounts pavable 1.133 226 Cu accounts navable and acensed expenses 503 1 S14 Other acpounts payable and accrued expenses 1.514 1636 Curent maturities of long-term debt 393 Curent maturities of long-temn debt, including capital leases 231 To abilities abilities Long-term debt 3099 oge Deferred taxes Defemed taxes 1,192 817 888 1,192 Otber liabilities 7487 Total Liabilities 907 Stockholders' Equity Common stock Stockholders' Equity Common stock dldaal paid-in capital 118 108 118 capital Reinvested eamings Accumulated other comprehensive (loss) 2.222 021 (805) (1230) Accamulated other comprehensive (loss) (1209) 4,010 (805) Total Stockholders' Equity 5460 nbilitis and Stockholders' Equity S 13.042 S 12.581 S 13.068 $11424 Total Liabilities and Stockholders' Equity 201, 237 million (1) Common stock has a par value of S0.50 per share; 1,250 million shares are authorized. At January 28, 2012, 215.9 million shares were issued and outstanding. At January 29, 2011, 236.7 million shares were issued and outstanding. shares were is tued and outstandig dtJanuary 30 2010 236 milliar sheres were ircued and outrtandins g The accompanying notes are integral part ofthese consolidated financial statements integral part of these consolidated financial statements The accompanving notes are 510/2016 Fom 10-K3 510/2018 Fam 10-10 Table of Contents Table of Contents CONSOLIDATED STATEMENTS OF CASH FLOWS CONSOLIDATED BALANCE SHEETS (S in millions Cash flows from operating activities: 2011 2010 2009 (S in millions, except per share data) 2009 2008 Assets S 25 $ (152) S 389 Cur (ncome) from discontinued operations Cash in banks and in transit S 161 S 167 Adjustments to reconcile net loss)Vincome to net cash Cash short-tem investments 2,848 2,185 uivalents Manchandiae inaom Restuturing and managementt transition 314 Asset impairments and other charges 67 Income taxes receivable 399 357 Prepasd expenses and other To Net (eains)on sale of assets (6) 55 5367 Benefit plans expense 197 276 Property and equipment, net 5357 ,35 04her assets Stork.based campen sation $ 12.58 S 12,011 Excess tax benefits fiom stock-based compensation (10) Liabilities and Stockholders' Equity Current liabilities (153) 126 Change in eash fom: Inventory 297 (189) 235 349ut navable and accrmed expenses 1630 penses and other assets Marcbandise accounts payable Curent inoome taxes payable Current maturities of long-tem deht 93 (1D) (93) 12 iabilities (15) (54 Defered taxes 812 499 Net eash provided by operating activities Cash flows from investing activities 820 Other liabilities es (500) (499 634) Proceeds from sale of assets Stockholders' Equity Proceeds from joint venture distribution 53 Common stocko 118 111 Additional paid-in capital Cot inveatment, net Net eash (used in) investing activities Cash flows from inancing activities G6) (587 870 (485 Accumulated other comprehensive (loss) (1,230) (414) Total Stockholders' Equity 4,778 4,155 ng-term debt $ 12,58 $ 12,011 392 Total Liabilities and Stockholders' Equity Pavments of long-term debt (693) (113) (1) Common stock has a par value of $0.50 per share; 1,250 million shares are authorized.. shares were isswed and outstanding.. Financing costs January 30, 2010, 236 million January 31, 2009, 222 miliion shares were isswed and outstanding (189) (183) ommon Proceeds from issuance of stock warant 50 Stock repurchaao prognam (900) Ees tax benefits from stock-based compensation Tax withholding payments reimbursed by restricted stock 45) (used in) financing activities Net (decruaseyincrease in cash and cash equivalents Cash and cash equivalents at beginning of year Cash and cash equivalents at end of year N (389 650 2,622 3,011 2.352 integral part of these consolidated financial statements. $ 1,507 S 3,011 S2,622 The accompanying notes are flow information: F-4 ina d s 91 $ 130 50 227 258 264 Interest paid Interest received Significant non-cash transactions: W101 htpswwwgowrdhvesedgaridata1108126/0001193125121307mse11910mn tps:www.sec.aowrchivesledaor/data/1108120/000118312510071527410k hm Table of Contents The expense for these plans, which was predominantly included in SG&A expenses on the Consolidated Statements of Operations, was as follows: (S in millions Savings Plan-401(k) Savings Plan-retirement account Mirror Savings Plan 2011 2010 2009 $ 52 $ 41 $ 55 11 12 8 4 3 2 Total $ 56 $ 65 $67 17) Restructuring and Management Transition Charges In 2011 and 2010, we incurred $451 million and $32 million, respectively, of restructuring and management transition charges. Restructuring and management transition charges include costs related to activities to streamline our supply chain operations, exit our catalog and catalog outlet businesses, cost savings initiatives to reduce store and home office expenses the VERP, management transition charges related to the hiring and departure of certain members ofmanagement and other miscellaneous restructuring costs including the exit ofour two specialty websites, CLADTM and Gifting GraceTm Supply chain As a result of consolidating and streamlining our supply chain organization as part ofa restructuring program during 2011, we recorded $28 million of increased depreciation, $8 million of costs to close and consolidate facilities and $5 million of employee severance. Increased depreciation resulted from shortening the useful lives ofassets related to the closing and consolidating of selected facilities. We are expecting to incur a total ofapproximately $55 million in expense related to this restructuring activity, with $41 million incurred in 2011 and the remainder to be incurred in 2012. Catalog and catalog outlet stores In the fourth quarter of 20 10, we announced our plan to exit the catalog outlet stores and wind down our catalog business. As result, in 2010 we recorded $17 million of increased depreciation and $4 million ofemployee severance. Increased depreciation resulted from shortening the useful lives ofassets associated with our catalog and catalog outlet stores. On October 16, 2011, we completed an asset purchase agreement to sell the assets related to the operations ofour catalog outlet stores. We sold fixed assets and inventory with combined net book values of approximately $31 million, for a total purchase price of $7 million, which resulted in a loss of $24 million. In 2011, we also recorded an additional $10 million of severance and other costs related to the sale ofour catalog outlet stores. In total for 2011 and 2010, we recorded $55 million related to the exit of our catalog and catalog outlet stores. We do not expect to incur any additional costs related to this program, as the catalog outlet stores were sold during 2011 and the catalog operations were discontinued at the end of 2010. Employment termination benefits In 2011 and 2010, we recorded $41 million and $4 million, respectively, ofemployee termination benefits for actions to reduce our store and home office expenses. We are expecting to incur additional charges in 2012 related to this restructuring activity VERP As a part of several restructuring and cost-savings initiatives designed to reduce salary and related costs across the Company, in August of 2011 we announced a VERP which was offered to F-38 5/10/20 Form 10-9 510/2016 Fam 10-10 Table of Contents Table of Contents The following table recanciles the activity for e restructuring and manngement transition liability for 2011 and 2010: th VERP Charzes included S176 million related to enhanced retirement benefits for the approximately 4.0000 associates who rour Supplemental Retirement Program and Benefit Catalog and accepted the VERP, $1 million related to curtailment charges million of costs associated with administering the VERP This pmeram wns completed in 2011 and wr do not expect to incur any additional costs related to the enhanced benefits associated with the VERP Terminatton Supply Outlet Management Transition (S in millions) , 2010 Chain Stores Benefits VERP Other nta Chames 21 32 Management transition Daring 2011, we announced and implemented several changes with in nanagement traiion casts ofsT30 million during the year. Konald B.Johnson became Chief Executive Officer on Cash payments r management leadership team which resulted in (17y (24. January 29, 2011 January 27,2012, at which time he retired from the Company. Daring 2011, we incarred transition charges of $53 million and $29 million related to Mr. Johnson and Mr. Ullman, respectively. In October 2011, Michael R. Francis was appointed Charges 41 34 179 30 451 ents Nocb (17) nova (177X) mbe $ 19 $ 60 January 28, 2012 2011, Michael W. Kramer and Daniel E. Walker were appointed Chief Operating Officer and Chief Talent Oficer, respectively, 28 10 )Amounts represent increared depreciotion as a result of shortening the useful lives of assets associated with our catalog outlet stores and owr supply chain and custom decorating operation. million of management transition charges primarily rel sof management in 2011 ur primary plan and $44 million that increased the other anfunded status of our Supplemental Retirement Program and Benefit Restoration Plan on October 15, 2011 (4) Amount represents stock-based compensation expense related to management transitions. In 2011, we recorded $26 million of charges primarily related to the restructuring activities associated with streamlining our custom decorating operations and the exit of our specialty websites CLAD and Gifting Grace. In 2010 we recorded $7 million 18) Real Estate and Other, Net 2011 and 2010. we recerded $4 million and $3 million, respectively. of charres primarily related to increased depreciation as a result of closing and consolidating facilities related to our custom decorating operations. In the fourth quarter of 2011, we 2011 2010 2009 temination costs. In 2011 and 2010, we incured S14 million and $4 million. respectively, of additional miscellanequs S in milliong) (34) 34 restructuring costs. We expect to incur an additional $2 million of costs associated with the exit of our specialty websites in itional costs associated with any ofthe other Imnsiments (Note 9) miscallanecus restaucturing pmeams that were initiated in 2010 and 2011. Net gains frun le of real estate (61 (8 (2) 1 F-39 expense(income) investments are in BEITS as wel as investments in 13 inirt venturea that own reaionnl mall pronerties five as general pafner and eight as limited partner. Real estate and other also includes net gains from the sale of facilities and equipment that are no ,2010 and 2009. we received dividend income ftom our RETs totaling $10 millicn. $8 million and $8 million, respcctively 2011.2010 and 2009, we recorded investment income for our pmacrtional share of carminga from our ioint ventures totaling S13 million, SI5 million and $15 million, respectively EMC 5/10/2016 Form 10-K Table of Contents 20) Litigation, Other Contingencies and Guarantees We are subject to various legal and governmental proceedings involving routine litigation incidental to our business. Reserves have been established based on our best estimates of our potential liability in certain of these matters. These estimates have been developed in consultation with in-house and outside counsel. While no assurance can be given as to the ultimate outcome of these matters, we currently believe that the final resolution ofthese actions, individually or in the aggregate, will not have a material adverse effect on our results of operations, financial position, liquidity or capital resources. As of January 28, 2012, we estimated our total potential environmental liabilities to range from $21 million to $27 million and recorded our best estimate of $2 1 million in other liabilities in the Consolidated Balance Sheet as of that date, This estimate covered potential liabilities primarily related to underground storage tanks, remediation of environmental conditions involving our former drugstore locations and asbestos removal in connection with approved plans to renovate or dispose ofour facilities. We continue to assess required remediation and the adequacy ofenvironmental reserves as new infomation becomes available and known conditions are further delineated. If we were to incur losses at the upper end ofthe estimated range, we do not believe that such losses would have a material effect on our financial condition, results of operations or liquidity As part of the 2001 asset sale of J. C. Penney Direct Marketing Services, Inc., JCP signed a guarantee agreement with a maximum exposure of $20 million. Any potential claims or losses are first recovered from established reserves, then from the purchaser and finally from any state insurance guarantee fund before JCP's guarantee would be invoked. As a result, we do not believe that any potential exposure would have a material effect on our consolidated financial statements. stablishe *** In connection with the sale ofthe operations ofour catalog outlet stores (see Note 17), we assigned leases on 10 catalog outlet store locations to the purchaser. As part of the assignment agreements, we became third guarantor for all 10 ofthe assigned lease agreements. In the event oflease default by the purchaser, our maximum obligation under the lease guarantees, as of January 28, 2012, is $25 million, assuming acceleration of all lease payments. The 10 leases have expiration dates beginning in June 20 14 with the last lease expiring in November 2020 . 21) Quarterly Results of Operations (Unaudited) The following is a summary of our quarterly unaudited consolidated results of operations for 2011 and 2010: 2011 (S in millions, except EPS) First Quarter 3,943 1,595 Second Quarter 3,906 1,497 1,243 Third Quarter Fourth Quarter Total net sales S $ 3,986 5,425 1,637 1,343 Gross margin SG&A expenses Restructuring and management transition(2) Income/(loss) from continuing operations Net income/loss) Diluted earmings/(loss) per share(s) 1,489 1,281 1,242 93) 23(4) 265(5) 1546) 64 14 (143) (143) (87X7 (87) S 64 14 S 0.28 $ 0.07 (0.67) (0.41) F-43 Details of Macy's Financial Ratios Macy's (Ticker: M) Financial Ratio Year 0.219 1256/(0.5*(5933+5530)) 0.166 =847/0.5*(5530+4653)) 0.070 329/(0.5*(4701+4646)) 2011 Return on Equity 2010 2009 0.048 1256/26405 0.034 847/25003 0.014 329/23489 0.404 (26405-15738)/26405 0.407 (25003-14824)/25003 2011 Profit Margin 2010 2009 2011 Gross Margin 2010 0.405 289-13973)/23489 1.236 26405/(0.5*(22095+20631)) 1.193 25003/(0.5*(20631+21300)) 2009 2011 Asset Turnover 2010 1.081 23489/(0.5*(21300+22145)) 74.802 26405/(0.5*(368+338)) 66.675 25003/(0.5*(392+358) 65.429 289/(0.5*(358+360)) 3.187 15738/(0.5*(5117+4758)) 3.163=14824/(0.5*(4758+4615)) 2.97813973/(0.5*(4615+4769)) 2009 2011 A/R Turnover 2010 2009 2011 Inventory Turnover 2010 2009 2.724 (22095-5933)/5933 2.731 (20631-5530)/5530 2011 Debt-Equity Ratio 2010 3.531 2130-4701)/4701 1.401 8777/6263 1.362 6899/5065 2009 2011 Current Ratio 2010 1.545 6882/4454 0.510 (2827+368)/6263 0.366 (1464+392)/5065 0.459 =(1686+358)/4454 5.403 (1256+712+447)/447 2009 2011 Quick Ratio 2010 2009 2011 Times Interest Earned 3.280 (847+473+579)/579 2010 1.902 (329+178+562)/562 2009 5/10/2016 M-01.28.2012-10K Table of Contents Selected Financial Data Item 6, The selected financial data set forth below should be read in conjunction with the Consolidated Financial Statements and the notes thereto and the other infomation contained elsewhere in this report. 2011 2010 2009 2007 2008 (millions, except per share data) Consolidated Statement of Operations Data: Net sales S 26,405 S 25,003 23,489 S 24,892 26,313 Cost of sales (15.738) (14,824) (13,973) (15.009) (15,677) Gross margin 10.667 10,179 9.516 9,883 10,636 Selling, general and administrative expenses (8.281) (8,260) (8,062) (8,481) (8,554) Gain on sale costs and division consolidation custs properties, impairments, store closing 25 (25) (391) (398) Goodwill impairment charges (5,382) May integration costs (219) Operating income (loss) 2.411 1,894 1,063 (4,378) L.863 Interest expense (a) (447) (562) (579) (588) (579) Interest incone 28 36 6 Income (loss) from continuing operations before income taxes 1,968 1.320 507 (4,938) 1.320 Federal, state and local income tax benefit (expense) (712) (473) (178) 163 (411) Income (loss) from continuing operations 1,256 847 329 (4,775) 909 Discontinued operations, net of income taxes (b) (16) (4,775) $ Net income (loss) S 1.256 S 847 329 893 Basic earnings (loss) per share: Income (loss) from continuing operations $ $ 2.96 2.00 0.78 (11.34) S 2.04 Net income (loss) 2.96 2.00 0.78 (11.34) 2.00 Diluted earnings (loss) per share: Income (loss) from continuing operations 2.9 1.98 S 0.78 (11.34) 2.01 Net income (loss) 2.92 1.98 0.78 (1.34) 1.97 420,0 423.5 Average number of shares outstanding 422.2 420.4 445.6 Cash dividends paid per share 3500 2000 2000 527 5175 L08 Depreciation and amortization 1,150 1210 1.27 1.304 Capital expenditures 764 505 460 897 ,105 Balance Sheet Data (at year end): Cash and cash equivalents S 2.82 L.464 1,686 1.38 676 Total assets 22,095 20,631 21,300 22.145 27,789 1.103 454 Short-term debt 242 966 666 Long-term debt 6,655 6,971 8.456 8,733 9,087 Shareholders' equity 5,933 5,530 4,653 4,620 9,907 y changed its methodology for re The the effects of such change retroactively to fiscal 2008, Even though the Company considers the change to have had only an immaterial impact on its financial condition, results of operations and cash flows, the financial condition, results of operations and cash flows for the prior periods as previously reported have been adjusted to reflect the change. kErein debt deferred state income taxes from a blended rate basis to basis, and has reflected in 2010 includes approximately $66 million of expenses associated with the early retirement approximately $1,000 million of (a) Discontinued operations include the after-tax results of the After Hours Formalwear business, including an after-tax loss of $7 million on the disposal of (b) After Hours Formalwear. S10201 5102016 M-01.28.2012-100 Form 10-K Iabis of Contat Table of Contents MACY'S, INC. CONSOLIDATED BALANCE SHEETS (illions) MACY'S, INC. CONSOLIDAT CE SHEETS (millions) Jauary 28, 2012 Jaary 25, 2011 ASSETS January 29, 211 Current Assets January 3 2 ASSETS Cash and cash equivalents 2827 S 1464 Current Ascete Receivables 368 338 Cash and cash equivalents L686 1,464 Merchandise inventories 5.117 4* Receivables 33 8 39a Pre r current assets Prepaid expenses and other cument assets 28 221 Total Curent Asgets 8,777 6,899 Total Current Assets 6.899 6,882 Property and Equipment-net 8420 8.813 8,813 Property and Equipment-net 9.507 Goodwill 3.743 3,743 Goodwill 3,743 ngible Assets-net , 743 sS7 ... gible Assets-net Total Assets 22.095 S 20.631 Other Assets 535 490 20,631 21.300 LIABILITIES AND SHAREHOLDERS EQUITY Tetal Assets LIABILITIES AND SHAREHOLDERS' EQUITY Current Liabilities: Cur Short-term debt 1.103 S 454 Short-tean debt Merchandise accounts payable 45 242 1.421 .312 Accounts navahle and accraed liabilities 2 525 788 able and acerued liabilities Income taxes Defered income taxes Total Curent Liabilities 371 182 Income taxes 364 214 Defered income taxes 408 409 Total Current Liabilities 6,263 4,991 Long-Tem Deferred Income Taxes 1245 1.132 Deferred Inc Taxes L141 1200 2,103 1,939 Other Liabilities 1.820 599 Other Liabilities Shareholders Equity Shareholdens' Equity: 420.8 shares outstanding) Common stock (414.2 and 423.3 shares outstanding) ddinional naidein canital 5.696 689 capital 408 5.696 Accumalated equity Treasury stock Accum Total Shareholders' Equity Total Liabilities 2,990 (2.431) 2.227 Accumulated equity 4.015 2.990 (2,515) 3 ) (2434) (2431) Treasury stock ve loss (730 Accumulated other comprehensive loss Total Shareholders' Equity (1,061) S 933 5,530 Shareholders' Equity 20.631 21.300 22.095 S 20.63 Total Liabilitios and Shareholders' Equity $ The accompanying notes are an integral part ofthese Conssolidated Financial Statementts integrnl part ofthese Consolidated Financial Statements, The accompanying notes are M-01.28.2012-10es S102016 6/10/2016 Errm 10 K e of Contents MACY'S, INC. MACY'S, INC CONSOLIDATED BALANCE SHEETS CONSOLIDATED ST S OF CASH FLOWS (millions) (millions) January 31, 20 Jaasary 3, 2010 ASSETS 2014 Current Assets Cach flows from operving ativities: hequivalents 1,6 Ne income L256 $47 329 Roceivahles As vidnd hy onratng activaies me to net cash Merchandise inventories 4,615 1.769 Sapp Total Curent Assets enses. Gan cn sale of properics, impaiments, store cksing 6 882 6.740 (25) 24 391 9.507 10,442 Property and Equipment-net Depreciion and anoetization Stock-based copensation expense LI50 211 Goodwill 3.743 743 70 66 Amotivaticn ofravncing costs and nremium on acouired debt Other Intangible Assets-net 678 719 (15) (23 (25) Chnges Other Assets s 21 300 7 otal Assets 22 vables (37) (51) (Incres) doreise i merdhdise invenkris LIABILITIES AND SHAREHOLDERS (359) (143) 154 EQUITY Current Liabilities (Increase) derense in prepaid expeses and other curent assets (991 (10) 24: 966 (Increaso) docre in other assets not sepratoly idetified Macbandise accounts payable 1.312 287 143 25 Accounts payable and accrued liabilities 2,626 2.628 Increase (decrease) it aooounts onable and ascrued lisbiies no sepely idtifiod 00 (45 201 Deferred income taxes 222 04 4454 Total Current Liabilities 5.126 Long-Term Debt 8,456 8733 Drzuse in other labilities not seradly identified (757 1 506 (384) (372) 1,119 Deferred Income Taxes 1,0 Net cash provided by operating activities n93 750 2,621 2,521 Cash lows fr investing activics Sharcholders" Equity: (555) (355) Common stock (420.8 and 420.1 shares outstanding) Cid dpmcnt apita A ulated eaity 2274 Dispasition of property and equipment Proceeds frum insuranoe clas Oder, net 14 14 60 008 Treasury stock Acr (2.514) (2.544) 6 21 nsive loss 27 (40) (3) l hrboalders Fauity 4701 646 Nt geh (617) (377 (463) 1sed by investieg activities 21,300 22,145 Total Liabilities and Shareholders' Equity Cash flows rom Dencine actlvitie Deise 800 Financieg costs (20) L245 Debt id (454) (966) Daidends paid (148) (84) (84) outstanding checks The accompanving notes are an integral nart of these Consolidated Financial Statements. aiaitka of tmasury sock (S02) 41 F-S Issarce of common siock 167 43 Net ab used by finncng activities 113 1,263 11,072x Net increase (decrease) ia cesh and cash equivalents 1,363 (222) JUL 2827 L464 L6e Cash atd ueh eauivalents end of perkd Supplanental ads low informetion