Answered step by step
Verified Expert Solution
Link Copied!

Question

1 Approved Answer

Main Post:1) Describe the distribution shape of the population of penny ages (i.e., left skewed, symmetric, right skewed).2) On your copy of the Penny Population

Main Post:1) Describe the distribution shape of the population of penny ages (i.e., left skewed, symmetric, right skewed).2) On your copy of the Penny Population document, randomly select 5 penny ages from this population. Calculate the mean of this Nickel Sample (sample size n = 5). How does this compare to the population mean?3) On your copy of the Penny Population document, randomly select 10 penny ages from this population. Calculate the mean of this Dime Sample (sample size n = 10). How does this compare to the population mean?4) On your copy of the Penny Population document, randomly select 25 penny ages from this population. Calculate the mean of this Quarter Sample (sample size n = 25). How does this compare to the population mean?5) Enter your Nickel Sample mean, Dime Sample mean, and Quarter Sample mean in the Sampling Form sent by your instructor. It will generate a histogram of the class means for each sample (Nickel Samples, Dime Samples, and Quarter Samples).6) Copy and paste the class histograms as they look so far for others to review in the discussion.
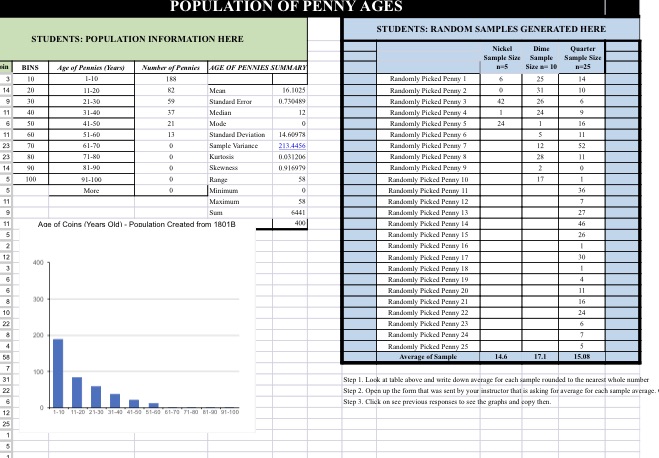
image text in transcribed
POPULATION OF PENNY AGES STUDENTS: RANDOM SAMPLES GENERATED HERE STUDENTS: POPULATION INFORMATION HERE Nicked Dim Quarter Sample Size Sample BINS Ape of Provin /Karl AGE OF PENNIES SUMMARY 1 5 1 15 Randomly Picked Penny I 25 14 20 1-20 Main 16.1035 Randomly Picked Penny 2 10 30 21-30 Standard Error 0.730184 Randomly Picked Penny ] 42 26 11 40 31-40 37 Median 12 Randomly Picked Penny 4 1 24 41-90 21 Made Randomly Picked Penny 5 11 60 51-6D 13 Standard Deviation 14.60973 Randomly Picked Penny & 23 61-70 Sample Variance 213.4456 Randomly Picked Penny 7 71-RD DO8 1206 Randomly Picked Penny 14 41-90 Shownas Randomly Picked Penny " 21-100 Randomly Picked Penny 10 Marc Minimum Randomly Picked Penny 11 Maximum Randomly Picked Penny 12 Sum 6441 Rrandomly Picked Penny 13 11 Ane of Coins Years Old\\ - Population Created from 18018 40 Randomly Picked Penny 14 Randomly Picked Penny IS Randomly Picked Penny 16 12 400 Randomly Picked Penny 17 Randomly Picked Penny IS Randomly Picked Penny 19 Randomly Picked Penny 20 Randomly Picked Penny 21 10 Readonly Picked Penny 22 Randomly Picked Penny 23 Randomly Picked Penny 24 Randomly Picked Penny 25 Artrape of sample 14.6 17.1 7 31 Step 1. Look at table above and write down average for each sample rounded to the nearest whole number 22 Step 2. Open up the form that was sen by your mistructor theit is asking for average for each sample incrage Step 3. Click on see previous responses to see the graphs and copy then. 12 1- 10 11-30 21-10 31-40 41-34 51-60 BI-NJ 71-20 61-20 91-140 1

Step by Step Solution

There are 3 Steps involved in it

Step: 1

blur-text-image

Get Instant Access to Expert-Tailored Solutions

See step-by-step solutions with expert insights and AI powered tools for academic success

Step: 2

blur-text-image_2

Step: 3

blur-text-image_3

Ace Your Homework with AI

Get the answers you need in no time with our AI-driven, step-by-step assistance

Get Started

Recommended Textbook for

Introduction to graph theory

Authors: Douglas B. West

2nd edition

131437372, 978-0131437371

More Books

Students also viewed these Mathematics questions

Question

\f

Answered: 1 week ago