

Answered step by step
Verified Expert Solution
Question
1 Approved Answer
make a AD/ AS diagram showing the imapct of the policy decisons for each year for 7 years based on the tables. so 7 graphs
make a AD/ AS diagram showing the imapct of the policy decisons for each year for 7 years based on the tables. so 7 graphs 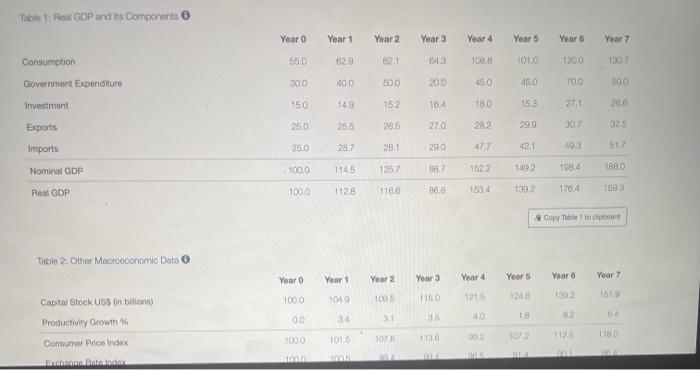
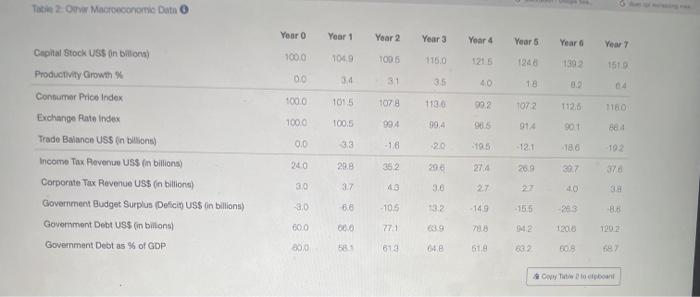
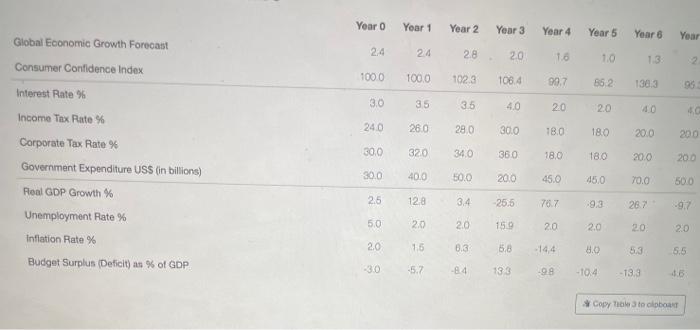
Table 1: Real GDP and Its Components Consumption Government Expenditure Investment. Exports Imports Nominal GDP Real GDP Table 2: Other Macroeconomic Data O Capital Stock US$ (n billions) Productivity Growth % Consumer Price Index Exchange Bate Jodex Year 0 66.0 30.0 15.0 25.0 26.0 100,0 100.0 Your 0 100.0 0.0 100,0 Year 1 82.9 40.0 14.9 26.5 28.7 114.5 112,8 Year 1 104.9 34 101,6 1005 Year 2 62.1 50.0 152 26.5 28.1 125/7 1166 Year 2 100.6 31 107.6 Year 3 64.3 2010 16,4 27.0 29.0 987 86.8 Year 3 1160 35 1130 Year 4 108.8 45.0 18.0 28.2 47.7 152.2 1534 Year 4 121.5 00.2 DAS Year 5 101.0 46.0 15.3 29.9 42.1 1492 139.2 Year 5 124.6 1.8 107.2 014 Year 6 120.0 70.0 27,1 307 49.3 Year 7 130/70 60.0 51,7 198,4 188.0 176.4 1593 Copy Table 1 to clipboard Year 6 Year 7 1392 82 04 1125 1180 001 and Table 2 Over Macroeconomic Data O Capital Stock US$ in billions) Productivity Growth % Consumer Price Index Exchange Rate Index Trade Balance USS (in billions) Income Tax Revenue US$ (in billions) Corporate Tax Revenue US$ (in billions) Government Budget Surplus (Deficit) US$ in billions) Government Debt US$ (in billions) Government Debt as % of GDP Year 0 100.0 0.0 100.0 100.0 0.0 24.0 30 3.0 60.0 800 Year 1 104.9 3.4 101.5 100,5 3.3 29.8 3.7 6.6 00.0 58.3 Year 2 109.5 31 1078 99/4 -1.6 36.2 43 -10.5 77.1 61.3 Year 3 115.0 35 113.6 99.4 20 29.6 13.2 64.8 Year 4 121.5 40 99.2 96.5 195 27.4 2.7 -14.9 61.8 Year 5 1246 18 107:2 914 -12.1 26.9 onest -15.5 94.2 63.2 Year 6 130.2 1126 901 -186 30.7 Year 7 151.9 1160) 884 192 9 37.6 38 26.3 -8.8 120.8 129.2 60.8 68.7 Copy Table 2 to clipboard Global Economic Growth Forecast Consumer Confidence Index Interest Rate % Income Tax Rate % Corporate Tax Rate % Government Expenditure US$ (in billions) Real GDP Growth % Unemployment Rate % Inflation Rate % Budget Surplus (Deficit) as % of GDP Year O 2.4 100.0 3.0 24.0 30.0 30.0 2.5 5.0 2.0 -3.0 Year 1 24 100.0 3.5 26.0 32.0 40.0 12.8 2.0 1.5 -5.7 Year 2 Year 3 Year 4 20 1.6 102.3 106.4 99.7 3.5 4.0 20 28.0 30.0 34.0 36.0 50.0 20.0 3.4 -25.5 2.0 15.9 6.3 5.8 -84 13.3 18.0 18.0 45.0 76.7 2.0 -14,4 -98 Year 5 Year 6 1.0 1.3 85.2 20 18.0 18.0 45.0 9.3 2.0 8.0 130.3 40 20.0 20.0 -10.4 70.0 Year 962 4G 20.0 28.7 2.0 5.3 5.5 -13.3 4.6 Copy Table 3 to clipboard 20.0 50.0 -9.7 2.0 Table 1: Real GDP and Its Components Consumption Government Expenditure Investment. Exports Imports Nominal GDP Real GDP Table 2: Other Macroeconomic Data O Capital Stock US$ (n billions) Productivity Growth % Consumer Price Index Exchange Bate Jodex Year 0 66.0 30.0 15.0 25.0 26.0 100,0 100.0 Your 0 100.0 0.0 100,0 Year 1 82.9 40.0 14.9 26.5 28.7 114.5 112,8 Year 1 104.9 34 101,6 1005 Year 2 62.1 50.0 152 26.5 28.1 125/7 1166 Year 2 100.6 31 107.6 Year 3 64.3 2010 16,4 27.0 29.0 987 86.8 Year 3 1160 35 1130 Year 4 108.8 45.0 18.0 28.2 47.7 152.2 1534 Year 4 121.5 00.2 DAS Year 5 101.0 46.0 15.3 29.9 42.1 1492 139.2 Year 5 124.6 1.8 107.2 014 Year 6 120.0 70.0 27,1 307 49.3 Year 7 130/70 60.0 51,7 198,4 188.0 176.4 1593 Copy Table 1 to clipboard Year 6 Year 7 1392 82 04 1125 1180 001 and Table 2 Over Macroeconomic Data O Capital Stock US$ in billions) Productivity Growth % Consumer Price Index Exchange Rate Index Trade Balance USS (in billions) Income Tax Revenue US$ (in billions) Corporate Tax Revenue US$ (in billions) Government Budget Surplus (Deficit) US$ in billions) Government Debt US$ (in billions) Government Debt as % of GDP Year 0 100.0 0.0 100.0 100.0 0.0 24.0 30 3.0 60.0 800 Year 1 104.9 3.4 101.5 100,5 3.3 29.8 3.7 6.6 00.0 58.3 Year 2 109.5 31 1078 99/4 -1.6 36.2 43 -10.5 77.1 61.3 Year 3 115.0 35 113.6 99.4 20 29.6 13.2 64.8 Year 4 121.5 40 99.2 96.5 195 27.4 2.7 -14.9 61.8 Year 5 1246 18 107:2 914 -12.1 26.9 onest -15.5 94.2 63.2 Year 6 130.2 1126 901 -186 30.7 Year 7 151.9 1160) 884 192 9 37.6 38 26.3 -8.8 120.8 129.2 60.8 68.7 Copy Table 2 to clipboard Global Economic Growth Forecast Consumer Confidence Index Interest Rate % Income Tax Rate % Corporate Tax Rate % Government Expenditure US$ (in billions) Real GDP Growth % Unemployment Rate % Inflation Rate % Budget Surplus (Deficit) as % of GDP Year O 2.4 100.0 3.0 24.0 30.0 30.0 2.5 5.0 2.0 -3.0 Year 1 24 100.0 3.5 26.0 32.0 40.0 12.8 2.0 1.5 -5.7 Year 2 Year 3 Year 4 20 1.6 102.3 106.4 99.7 3.5 4.0 20 28.0 30.0 34.0 36.0 50.0 20.0 3.4 -25.5 2.0 15.9 6.3 5.8 -84 13.3 18.0 18.0 45.0 76.7 2.0 -14,4 -98 Year 5 Year 6 1.0 1.3 85.2 20 18.0 18.0 45.0 9.3 2.0 8.0 130.3 40 20.0 20.0 -10.4 70.0 Year 962 4G 20.0 28.7 2.0 5.3 5.5 -13.3 4.6 Copy Table 3 to clipboard 20.0 50.0 -9.7 2.0 Step by Step Solution
There are 3 Steps involved in it
Step: 1

Get Instant Access to Expert-Tailored Solutions
See step-by-step solutions with expert insights and AI powered tools for academic success
Step: 2

Step: 3
Ace Your Homework with AI
Get the answers you need in no time with our AI-driven, step-by-step assistance
Get Started
Green And Sustainable Finance
Authors: Simon Thompson
2nd Edition
1398609242, 978-1398609242