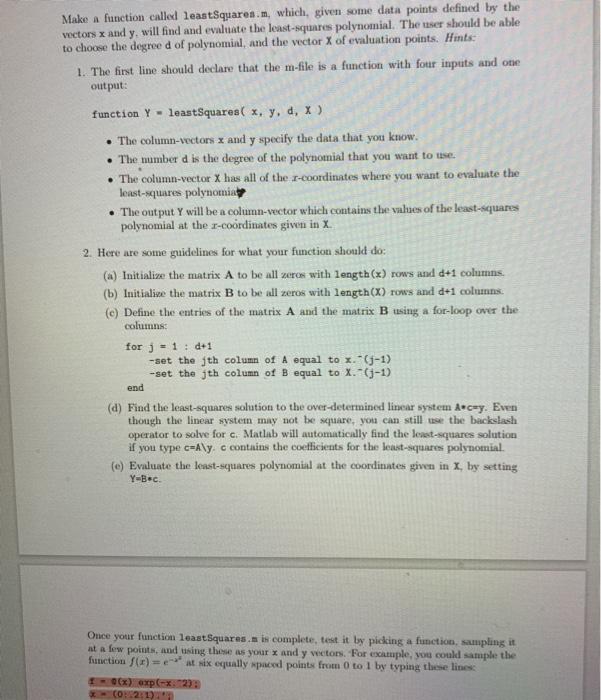
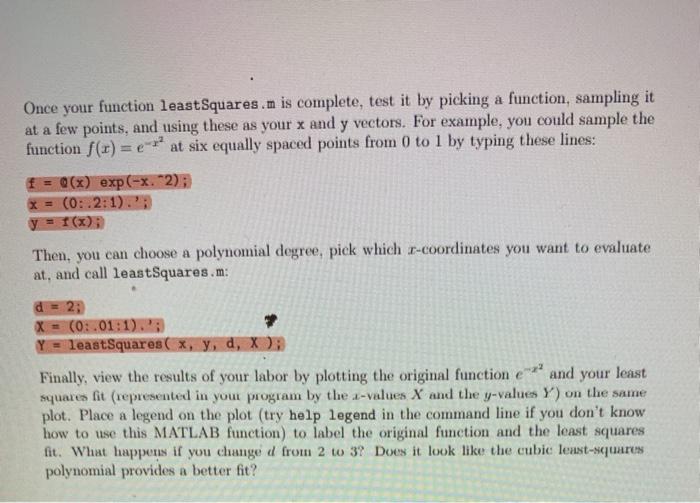
Make a function called leastSquares.m, which given some data points defined by the vectors x and y, will find and evaluate the least-squares polynomial. The user should be able to choose the degreed of polynomial, and the vector X of evaluation points. Hints 1. The first line should declare that the m-file is a function with four inputs and one output: function Y - leastSquares( x, y, d, X The column-vectors x and y specify the data that you know. The number d is the degree of the polynomial that you want to se The column-vector X has all of the I-coordinates where you want to evaluate the least squares polynomia The output Y will be a column-vector which contains the values of the least-squares polynomial at the r-coordinates given in X 2. Here are some guidelines for what your function should do (a) Initialize the matrix A to be all zares with length(x) rows and d+1 columns. (b) Initialize the matrix B to be all zeros with length(X) rows and d+1 columns. () Define the entries of the matrix A and the matrix B using a for-loop over the columns: for j = 1 : 0+1 - set the th column of A equal to 1.-(-1) -set the jth column of B equal to X.-(-1) end (d) Find the least-squares solution to the over-determined linear system Arcay. Even though the linear system may not be square, you can still use the backslash operator to solve for c. Matlab will automatically find the least squares solution if you type c=A\y. c contains the coefficients for the least-squares polynomial (e) Evaluate the least squares polynomial at the coordinates given in X, by setting Y=Bc. Once your function leastSquares.n is complete, test it by picking a function, sampling it at a few points, and using these as your x and y vectors. For example, you could sample the function (r)= at nix equally spaced points from 0 to 1 by typing these lines I)exp*.233 CO2:1) Once your function leastSquares.m is complete, test it by picking a function, sampling it at a few points, and using these as your x and y vectors. For example, you could sample the function f(x) = er at six equally spaced points from 0 to 1 by typing these lines: f = Q(x) exp(-x. 2) x = (0:2:1). y = f(x); Then, you can choose a polynomial degree, pick which r-coordinates you want to evaluate at, and call leastSquares.m: = 2; X = (0:01:1). Y = leastSquares (x, y, d, X) Finally, view the results of your labor by plotting the original function e*? and your least squares lit (represented in your program by the A-values X and the y-values Y) on the same plot. Place a legend on the plot (try help legend in the command line if you don't know how to use this MATLAB function) to label the original function and the least squares fit. What happens if you changed from 2 to 3? Does it look like the cubic least-squares polynomial provides a better fit


