Answered step by step
Verified Expert Solution
Link Copied!

Question

1 Approved Answer

Make a Pie Chart using Excel for the credit hours generated by different schools at Alcorn State University in 2016-17 Academic year. Make sure to
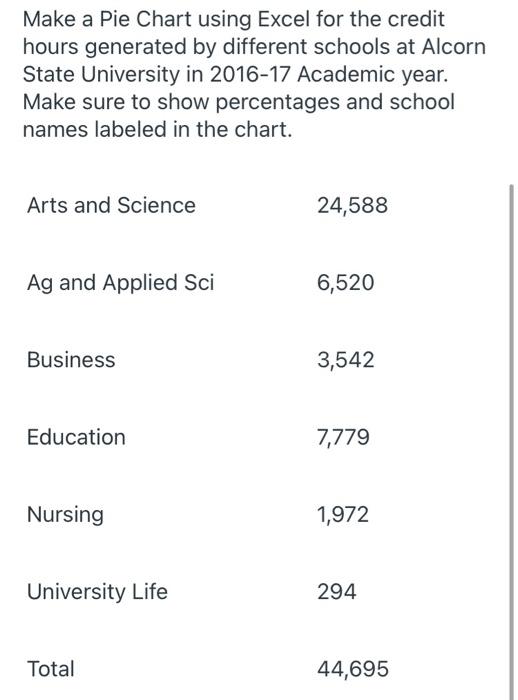
image text in transcribed
Make a Pie Chart using Excel for the credit hours generated by different schools at Alcorn State University in 2016-17 Academic year. Make sure to show percentages and school names labeled in the chart. Arts and Science 24,588 Ag and Applied Sci 6,520 Business 3,542 Education 7,779 Nursing 1,972 University Life 294 Total 44,695

Step by Step Solution

There are 3 Steps involved in it

Step: 1

blur-text-image

Get Instant Access to Expert-Tailored Solutions

See step-by-step solutions with expert insights and AI powered tools for academic success

Step: 2

blur-text-image

Step: 3

blur-text-image

Ace Your Homework with AI

Get the answers you need in no time with our AI-driven, step-by-step assistance

Get Started

Recommended Textbook for

More Books

Students also viewed these Finance questions

Question

what did you personally learn from compiling the model syllabus

Answered: 1 week ago