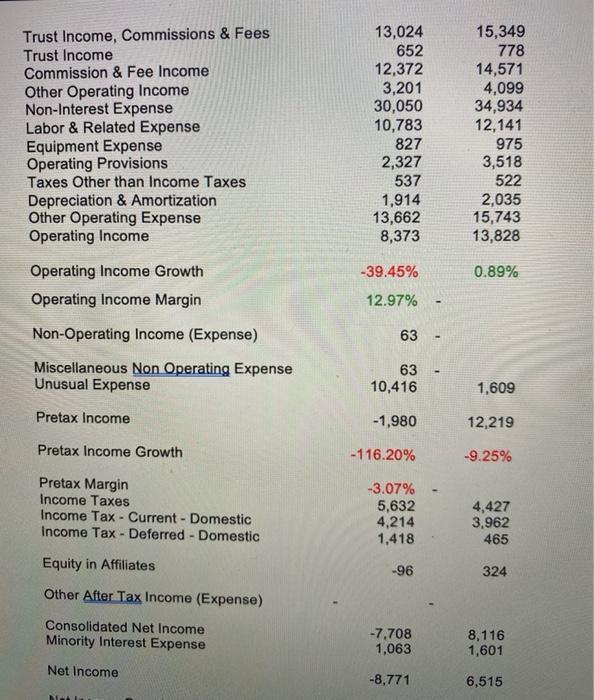
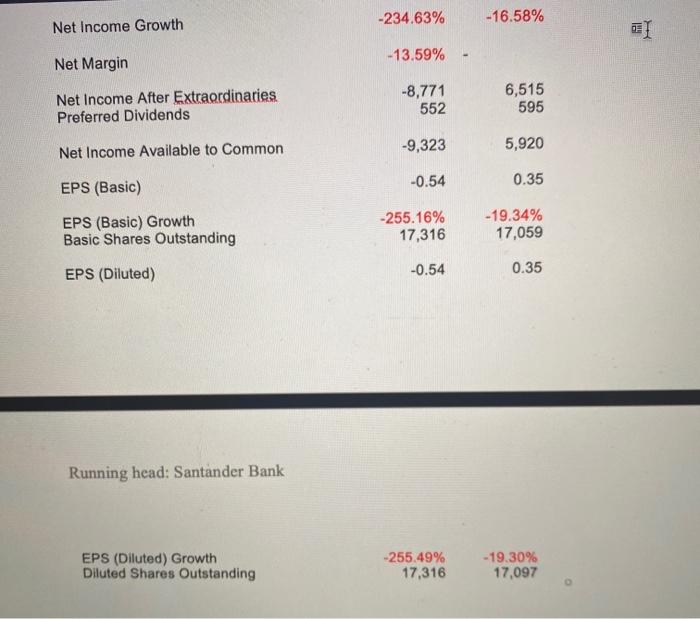
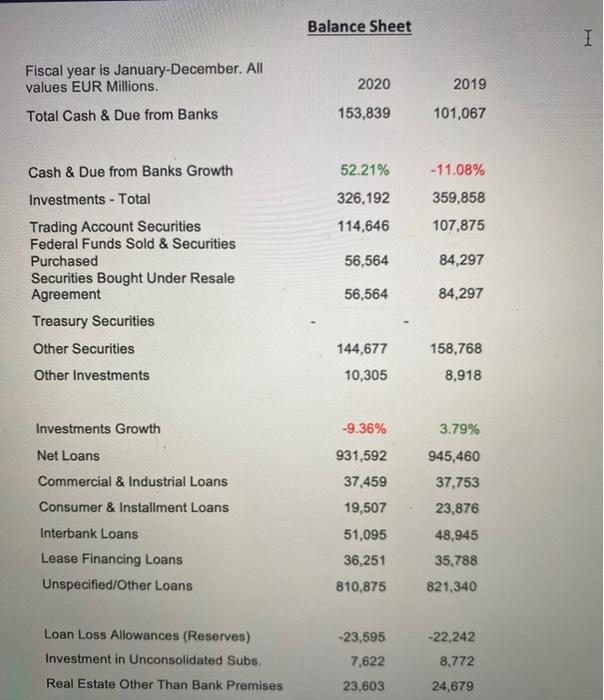
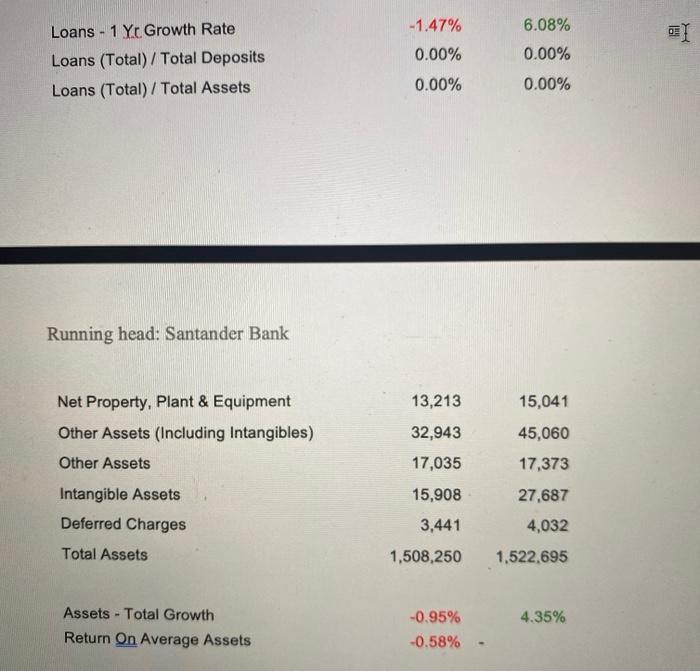
Make a Ratio Analysis of this bank with the following information
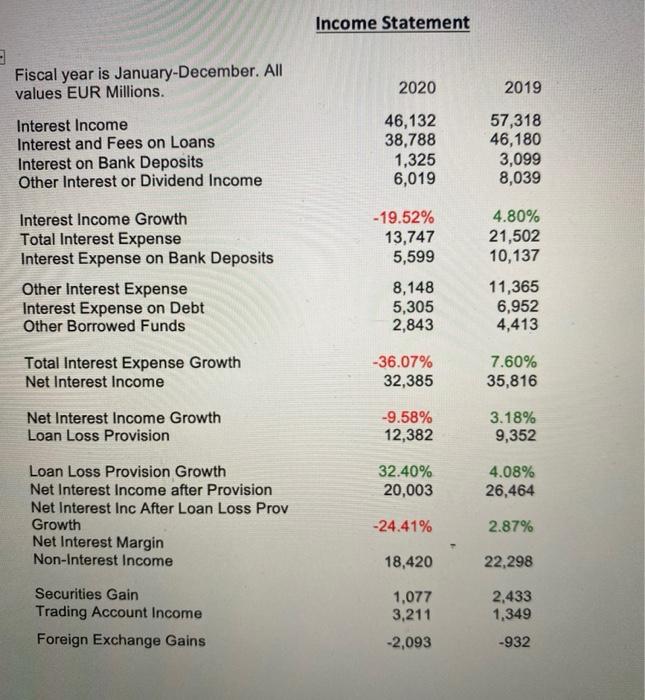
Make a ratio analysis (Profitabilitiy ratio, liquidity ratio, activity ratio, debt ratio and market ratio) for the following bank and give a summary fro what each of the ratios represents
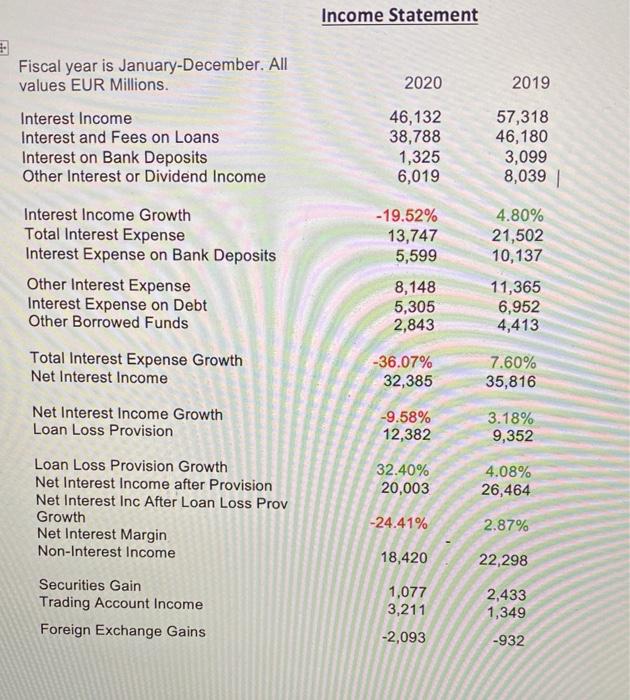
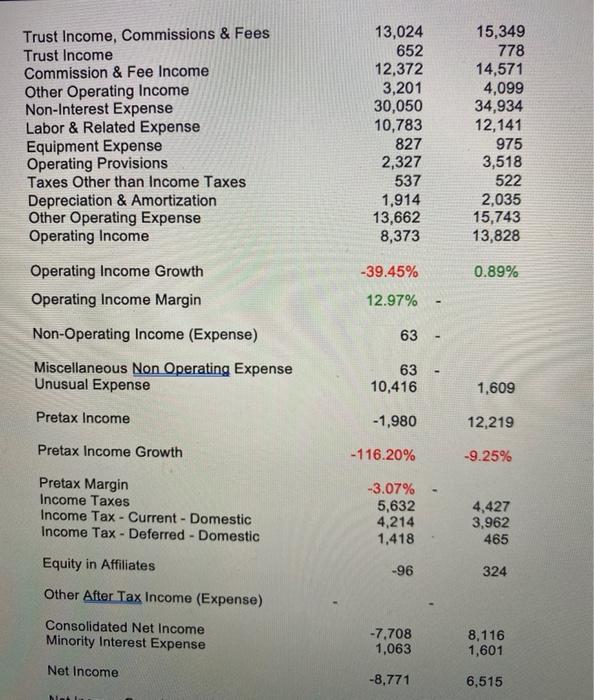
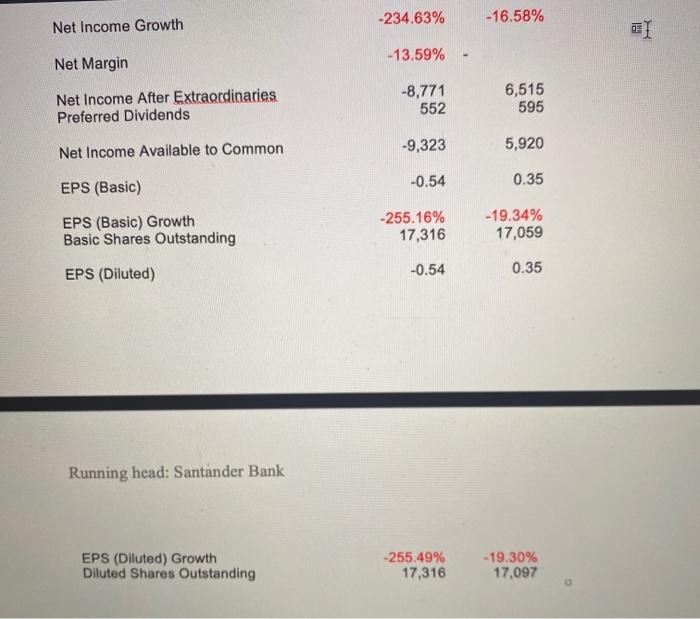
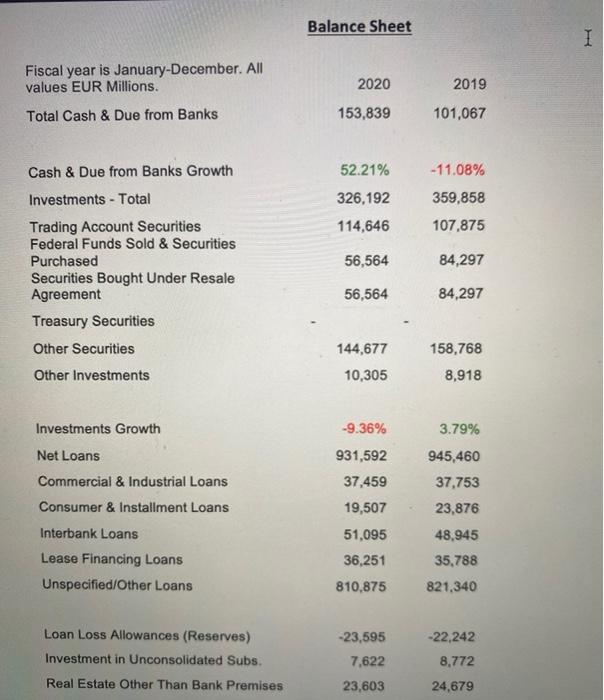
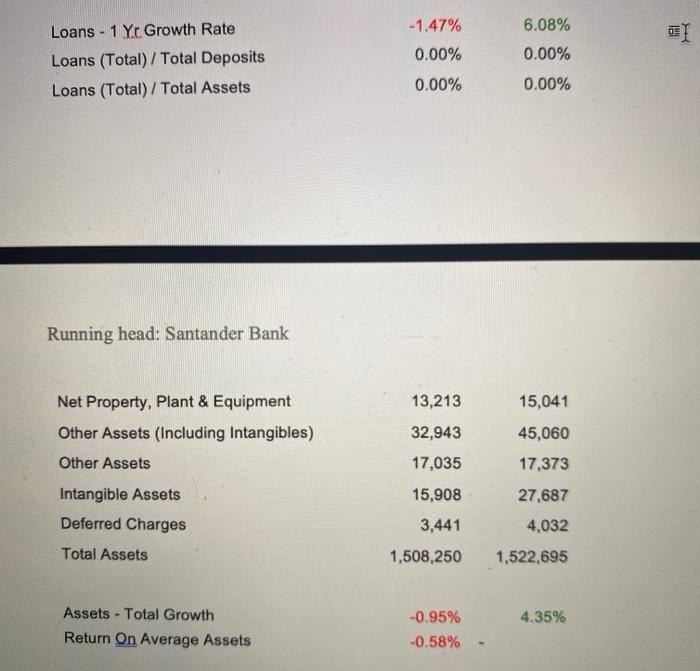
Income Statement Fiscal year is January-December. All values EUR Millions. 2020 2019 Interest Income Interest and Fees on Loans Interest on Bank Deposits Other Interest or Dividend Income 46,132 38,788 1,325 6,019 57,318 46,180 3,099 8,039 -19.52% 13,747 5,599 4.80% 21,502 10,137 Interest Income Growth Total Interest Expense Interest Expense on Bank Deposits Other Interest Expense Interest Expense on Debt Other Borrowed Funds 8,148 5,305 2,843 11,365 6,952 4,413 Total Interest Expense Growth Net Interest Income -36.07% 32,385 7.60% 35,816 Net Interest Income Growth Loan Loss Provision -9.58% 12,382 3.18% 9,352 32.40% 20,003 4.08% 26,464 Loan Loss Provision Growth Net Interest Income after Provision Net Interest Inc After Loan Loss Prov Growth Net Interest Margin Non-Interest Income -24.41% 2.87% 18,420 22,298 Securities Gain Trading Account Income Foreign Exchange Gains 1,077 3,211 -2,093 2,433 1,349 -932 Trust Income, Commissions & Fees Trust Income Commission & Fee Income Other Operating Income Non-Interest Expense Labor & Related Expense Equipment Expense Operating Provisions Taxes Other than Income Taxes Depreciation & Amortization Other Operating Expense Operating Income 13,024 652 12,372 3,201 30,050 10,783 827 2,327 537 1,914 13,662 8,373 15,349 778 14,571 4,099 34,934 12,141 975 3,518 522 2,035 15,743 13,828 -39.45% 0.89% Operating Income Growth Operating Income Margin 12.97% Non-Operating Income (Expense) 63 - Miscellaneous Non Operating Expense Unusual Expense 63 - 10,416 1,609 Pretax Income -1,980 12,219 Pretax Income Growth -116.20% -9.25% Pretax Margin Income Taxes Income Tax - Current - Domestic Income Tax - Deferred - Domestic -3.07% 5,632 4,214 1,418 4,427 3,962 465 Equity in Affiliates -96 324 Other After Tax Income (Expense) Consolidated Net Income Minority Interest Expense -7.708 1,063 8,116 1,601 Net Income -8,771 6,515 -234.63% -16.58% Net Income Growth THI I I -13.59% Net Margin Net Income After Extraordinaries Preferred Dividends -8,771 552 6,515 595 Net Income Available to Common -9,323 5,920 -0.54 0.35 EPS (Basic) EPS (Basic) Growth Basic Shares Outstanding -255.16% 17,316 -19.34% 17,059 -0.54 0.35 EPS (Diluted) Running head: Santander Bank EPS (Diluted) Growth Diluted Shares Outstanding - 255.49% 17,316 -19.30% 17,097 Balance Sheet I Fiscal year is January-December. All values EUR Millions. 2020 2019 Total Cash & Due from Banks 153,839 101,067 Cash & Due from Banks Growth 52.21% Investments - Total 326,192 -11.08% 359,858 107,875 114,646 56,564 84,297 Trading Account Securities Federal Funds Sold & Securities Purchased Securities Bought Under Resale Agreement Treasury Securities Other Securities 56,564 84,297 144,677 10,305 158,768 8,918 Other Investments Investments Growth -9.36% 3.79% Net Loans Commercial & Industrial Loans Consumer & Installment Loans 931,592 37,459 19,507 51,095 36,251 810,875 945,460 37,753 23,876 48,945 35.788 821,340 Interbank Loans Lease Financing Loans Unspecified/Other Loans Loan Loss Allowances (Reserves) Investment in Unconsolidated Subs, -23,595 7,622 23,603 -22,242 8,772 Real Estate Other Than Bank Premises 24,679 -1.47% 6.08% 0.00% OEI 0.00% Loans - 1 Yc Growth Rate Loans (Total) / Total Deposits Loans (Total) / Total Assets 0.00% 0.00% Running head: Santander Bank 13,213 15,041 Net Property, Plant & Equipment Other Assets (Including Intangibles) Other Assets 32,943 45,060 17,373 Intangible Assets Deferred Charges 17,035 15,908 3,441 1,508,250 27,687 4,032 Total Assets 1,522,695 4.35% Assets - Total Growth Return On Average Assets -0.95% -0.58% Income Statement Fiscal year is January-December. All values EUR Millions. 2020 2019 Interest Income Interest and Fees on Loans Interest on Bank Deposits Other Interest or Dividend Income 46,132 38,788 1,325 6,019 57,318 46,180 3,099 8,039 | -19.52% 13,747 5,599 Interest Income Growth Total Interest Expense Interest Expense on Bank Deposits Other Interest Expense Interest Expense on Debt Other Borrowed Funds 4.80% 21,502 10,137 11,365 6,952 4,413 8,148 5,305 2,843 Total Interest Expense Growth Net Interest Income -36.07% 32,385 7.60% 35,816 Net Interest Income Growth Loan Loss Provision -9.58% 12,382 3.18% 9,352 32.40% 20,003 4.08% 26,464 Loan Loss Provision Growth Net Interest Income after Provision Net Interest Inc After Loan Loss Prov Growth Net Interest Margin Non-Interest Income -24.41% 2.87% 18,420 22,298 Securities Gain Trading Account Income Foreign Exchange Gains 1,077 3,211 -2,093 2,433 1,349 -932 Trust Income, Commissions & Fees Trust Income Commission & Fee Income Other Operating Income Non-Interest Expense Labor & Related Expense Equipment Expense Operating Provisions Taxes Other than Income Taxes Depreciation & Amortization Other Operating Expense Operating Income 13,024 652 12,372 3,201 30,050 10,783 827 2,327 537 1.914 13,662 8,373 15,349 778 14,571 4,099 34,934 12,141 975 3,518 522 2,035 15,743 13,828 -39.45% 0.89% Operating Income Growth Operating Income Margin 12.97% Non-Operating Income (Expense) 63 - Miscellaneous Non Operating Expense Unusual Expense 63 - 10,416 1,609 Pretax Income -1,980 12,219 Pretax Income Growth -116.20% -9.25% Pretax Margin Income Taxes Income Tax - Current - Domestic Income Tax - Deferred - Domestic -3.07% 5,632 4,214 1,418 4,427 3,962 465 Equity in Affiliates -96 324 Other After Tax Income (Expense) Consolidated Net Income Minority Interest Expense -7.708 1,063 8,116 1,601 Net Income -8.771 6,515 ha -234.63% -16.58% Net Income Growth THI I -13.59% Net Margin Net Income After Extraordinaries Preferred Dividends -8,771 552 6,515 595 Net Income Available to Common -9,323 5,920 -0.54 0.35 EPS (Basic) EPS (Basic) Growth Basic Shares Outstanding -255.16% 17,316 -19.34% 17,059 -0.54 0.35 EPS (Diluted) Running head: Santander Bank EPS (Diluted) Growth Diluted Shares Outstanding - 255.49% 17,316 -19.30% 17,097 Balance Sheet I Fiscal year is January-December. All values EUR Millions. 2020 2019 Total Cash & Due from Banks 153,839 101,067 52.21% -11.08% Cash & Due from Banks Growth Investments - Total 326,192 359,858 107,875 114,646 56,564 84,297 Trading Account Securities Federal Funds Sold & Securities Purchased Securities Bought Under Resale Agreement Treasury Securities Other Securities 56,564 84,297 158,768 144,677 10,305 Other Investments 8,918 Investments Growth -9.36% 3.79% Net Loans 931,592 37,459 Commercial & Industrial Loans Consumer & Installment Loans 945,460 37,753 23,876 Interbank Loans 19,507 51,095 36,251 Lease Financing Loans Unspecified/Other Loans 48,945 35.788 821,340 810,875 Loan Loss Allowances (Reserves) Investment in Unconsolidated Subs. -23,595 7,622 23,603 -22,242 8,772 24,679 Real Estate Other Than Bank Premises -1.47% 6.08% 0.00% EI 0.00% Loans - 1 Yc Growth Rate Loans (Total) / Total Deposits Loans (Total) / Total Assets 0.00% 0.00% Running head: Santander Bank 13,213 Net Property, Plant & Equipment Other Assets (Including Intangibles) Other Assets 32,943 15,041 45,060 17,373 27,687 17,035 15,908 Intangible Assets Deferred Charges 3,441 4,032 Total Assets 1,508,250 1,522,695 4.35% Assets - Total Growth Return On Average Assets -0.95% -0.58% Income Statement Fiscal year is January-December. All values EUR Millions. 2020 2019 Interest Income Interest and Fees on Loans Interest on Bank Deposits Other Interest or Dividend Income 46,132 38,788 1,325 6,019 57,318 46,180 3,099 8,039 -19.52% 13,747 5,599 4.80% 21,502 10,137 Interest Income Growth Total Interest Expense Interest Expense on Bank Deposits Other Interest Expense Interest Expense on Debt Other Borrowed Funds 8,148 5,305 2,843 11,365 6,952 4,413 Total Interest Expense Growth Net Interest Income -36.07% 32,385 7.60% 35,816 Net Interest Income Growth Loan Loss Provision -9.58% 12,382 3.18% 9,352 32.40% 20,003 4.08% 26,464 Loan Loss Provision Growth Net Interest Income after Provision Net Interest Inc After Loan Loss Prov Growth Net Interest Margin Non-Interest Income -24.41% 2.87% 18,420 22,298 Securities Gain Trading Account Income Foreign Exchange Gains 1,077 3,211 -2,093 2,433 1,349 -932 Trust Income, Commissions & Fees Trust Income Commission & Fee Income Other Operating Income Non-Interest Expense Labor & Related Expense Equipment Expense Operating Provisions Taxes Other than Income Taxes Depreciation & Amortization Other Operating Expense Operating Income 13,024 652 12,372 3,201 30,050 10,783 827 2,327 537 1,914 13,662 8,373 15,349 778 14,571 4,099 34,934 12,141 975 3,518 522 2,035 15,743 13,828 -39.45% 0.89% Operating Income Growth Operating Income Margin 12.97% Non-Operating Income (Expense) 63 - Miscellaneous Non Operating Expense Unusual Expense 63 - 10,416 1,609 Pretax Income -1,980 12,219 Pretax Income Growth -116.20% -9.25% Pretax Margin Income Taxes Income Tax - Current - Domestic Income Tax - Deferred - Domestic -3.07% 5,632 4,214 1,418 4,427 3,962 465 Equity in Affiliates -96 324 Other After Tax Income (Expense) Consolidated Net Income Minority Interest Expense -7.708 1,063 8,116 1,601 Net Income -8,771 6,515 -234.63% -16.58% Net Income Growth THI I I -13.59% Net Margin Net Income After Extraordinaries Preferred Dividends -8,771 552 6,515 595 Net Income Available to Common -9,323 5,920 -0.54 0.35 EPS (Basic) EPS (Basic) Growth Basic Shares Outstanding -255.16% 17,316 -19.34% 17,059 -0.54 0.35 EPS (Diluted) Running head: Santander Bank EPS (Diluted) Growth Diluted Shares Outstanding - 255.49% 17,316 -19.30% 17,097 Balance Sheet I Fiscal year is January-December. All values EUR Millions. 2020 2019 Total Cash & Due from Banks 153,839 101,067 Cash & Due from Banks Growth 52.21% Investments - Total 326,192 -11.08% 359,858 107,875 114,646 56,564 84,297 Trading Account Securities Federal Funds Sold & Securities Purchased Securities Bought Under Resale Agreement Treasury Securities Other Securities 56,564 84,297 144,677 10,305 158,768 8,918 Other Investments Investments Growth -9.36% 3.79% Net Loans Commercial & Industrial Loans Consumer & Installment Loans 931,592 37,459 19,507 51,095 36,251 810,875 945,460 37,753 23,876 48,945 35.788 821,340 Interbank Loans Lease Financing Loans Unspecified/Other Loans Loan Loss Allowances (Reserves) Investment in Unconsolidated Subs, -23,595 7,622 23,603 -22,242 8,772 Real Estate Other Than Bank Premises 24,679 -1.47% 6.08% 0.00% OEI 0.00% Loans - 1 Yc Growth Rate Loans (Total) / Total Deposits Loans (Total) / Total Assets 0.00% 0.00% Running head: Santander Bank 13,213 15,041 Net Property, Plant & Equipment Other Assets (Including Intangibles) Other Assets 32,943 45,060 17,373 Intangible Assets Deferred Charges 17,035 15,908 3,441 1,508,250 27,687 4,032 Total Assets 1,522,695 4.35% Assets - Total Growth Return On Average Assets -0.95% -0.58% Income Statement Fiscal year is January-December. All values EUR Millions. 2020 2019 Interest Income Interest and Fees on Loans Interest on Bank Deposits Other Interest or Dividend Income 46,132 38,788 1,325 6,019 57,318 46,180 3,099 8,039 | -19.52% 13,747 5,599 Interest Income Growth Total Interest Expense Interest Expense on Bank Deposits Other Interest Expense Interest Expense on Debt Other Borrowed Funds 4.80% 21,502 10,137 11,365 6,952 4,413 8,148 5,305 2,843 Total Interest Expense Growth Net Interest Income -36.07% 32,385 7.60% 35,816 Net Interest Income Growth Loan Loss Provision -9.58% 12,382 3.18% 9,352 32.40% 20,003 4.08% 26,464 Loan Loss Provision Growth Net Interest Income after Provision Net Interest Inc After Loan Loss Prov Growth Net Interest Margin Non-Interest Income -24.41% 2.87% 18,420 22,298 Securities Gain Trading Account Income Foreign Exchange Gains 1,077 3,211 -2,093 2,433 1,349 -932 Trust Income, Commissions & Fees Trust Income Commission & Fee Income Other Operating Income Non-Interest Expense Labor & Related Expense Equipment Expense Operating Provisions Taxes Other than Income Taxes Depreciation & Amortization Other Operating Expense Operating Income 13,024 652 12,372 3,201 30,050 10,783 827 2,327 537 1.914 13,662 8,373 15,349 778 14,571 4,099 34,934 12,141 975 3,518 522 2,035 15,743 13,828 -39.45% 0.89% Operating Income Growth Operating Income Margin 12.97% Non-Operating Income (Expense) 63 - Miscellaneous Non Operating Expense Unusual Expense 63 - 10,416 1,609 Pretax Income -1,980 12,219 Pretax Income Growth -116.20% -9.25% Pretax Margin Income Taxes Income Tax - Current - Domestic Income Tax - Deferred - Domestic -3.07% 5,632 4,214 1,418 4,427 3,962 465 Equity in Affiliates -96 324 Other After Tax Income (Expense) Consolidated Net Income Minority Interest Expense -7.708 1,063 8,116 1,601 Net Income -8.771 6,515 ha -234.63% -16.58% Net Income Growth THI I -13.59% Net Margin Net Income After Extraordinaries Preferred Dividends -8,771 552 6,515 595 Net Income Available to Common -9,323 5,920 -0.54 0.35 EPS (Basic) EPS (Basic) Growth Basic Shares Outstanding -255.16% 17,316 -19.34% 17,059 -0.54 0.35 EPS (Diluted) Running head: Santander Bank EPS (Diluted) Growth Diluted Shares Outstanding - 255.49% 17,316 -19.30% 17,097 Balance Sheet I Fiscal year is January-December. All values EUR Millions. 2020 2019 Total Cash & Due from Banks 153,839 101,067 52.21% -11.08% Cash & Due from Banks Growth Investments - Total 326,192 359,858 107,875 114,646 56,564 84,297 Trading Account Securities Federal Funds Sold & Securities Purchased Securities Bought Under Resale Agreement Treasury Securities Other Securities 56,564 84,297 158,768 144,677 10,305 Other Investments 8,918 Investments Growth -9.36% 3.79% Net Loans 931,592 37,459 Commercial & Industrial Loans Consumer & Installment Loans 945,460 37,753 23,876 Interbank Loans 19,507 51,095 36,251 Lease Financing Loans Unspecified/Other Loans 48,945 35.788 821,340 810,875 Loan Loss Allowances (Reserves) Investment in Unconsolidated Subs. -23,595 7,622 23,603 -22,242 8,772 24,679 Real Estate Other Than Bank Premises -1.47% 6.08% 0.00% EI 0.00% Loans - 1 Yc Growth Rate Loans (Total) / Total Deposits Loans (Total) / Total Assets 0.00% 0.00% Running head: Santander Bank 13,213 Net Property, Plant & Equipment Other Assets (Including Intangibles) Other Assets 32,943 15,041 45,060 17,373 27,687 17,035 15,908 Intangible Assets Deferred Charges 3,441 4,032 Total Assets 1,508,250 1,522,695 4.35% Assets - Total Growth Return On Average Assets -0.95% -0.58%


