Answered step by step
Verified Expert Solution
Question
1 Approved Answer
Make a spread sheet model in excel using optimation model Background Business Case 1: MOTOR CARRIER SELECTION AT WESTVACO Each year, Westvaco sells more than
Make a spread sheet model in excel using optimation model 


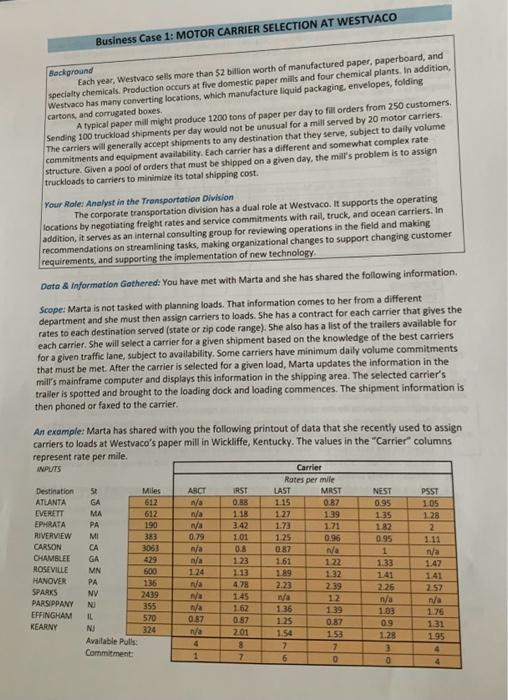
Background Business Case 1: MOTOR CARRIER SELECTION AT WESTVACO Each year, Westvaco sells more than $2 billion worth of manufactured paper, paperboard, and specialty chemicals. Production occurs at five domestic paper mills and four chemical plants. In addition, Westvaco has many converting locations, which manufacture liquid packaging, envelopes, folding cartons, and corrugated boxes. A typical paper mill might produce 1200 tons of paper per day to fill orders from 250 customers. Sending 100 truckload shipments per day would not be unusual for a mill served by 20 motor carriers. The carriers will generally accept shipments to any destination that they serve, subject to daily volume commitments and equipment availability. Each carrier has a different and somewhat complex rate structure. Given a pool of orders that must be shipped on a given day, the mill's problem is to assign truckloads to carriers to minimize its total shipping cost. Your Role: Analyst in the Transportation Division The corporate transportation division has a dual role at Westvaco. It supports the operating locations by negotiating freight rates and service commitments with rail, truck, and ocean carriers. In addition, it serves as an internal consulting group for reviewing operations in the field and making recommendations on streamlining tasks, making organizational changes to support changing customer requirements, and supporting the implementation of new technology Data & Information Gathered: You have met with Marta and she has shared the following information. Scope: Marta is not tasked with planning loads. That information comes to her from a different department and she must then assign carriers to loads. She has a contract for each carrier that gives the rates to each destination served (state or zip code range). She also has a list of the trailers available for each carrier. She will select a carrier for a given shipment based on the knowledge of the best carriers for a given traffic lane, subject to availability. Some carriers have minimum daily volume commitments that must be met. After the carrier is selected for a given load, Marta updates the information in the mill's mainframe computer and displays this information in the shipping area. The selected carrier's trailer is spotted and brought to the loading dock and loading commences. The shipment information is then phoned or faxed to the carrier. An example: Marta has shared with you the following printout of data that she recently used to assign carriers to loads at Westvaco's paper mill in Wickliffe, Kentucky. The values in the "Carrier" columns represent rate per mile. Carrier INPUTS Rates per mile Destination St Miles ABCT IRST LAST MRST NEST PSST ATLANTA GA 612 n/a 0.88 1.15 0.87 0.95 1.05 EVERETT MA 612 n/a 1.18 1.27 139 1.35 1.28 EPHRATA PA 1901 n/a 3.42 1.73 1.71 1.82 2 RIVERVIEW MI 383 0.79 1.01 1.25 0.96 0.95 1.11 CARSON CA 3063 nja 0.8 0.87 n/a 1 n/a CHAMBLEE GA 429 n/a 1.23 1.61 1.22 1.33 1.47 ROSEVILLE MN 600 1.24 1.13 1.89 1.32 141 1.41 HANOVER PA 136 n/a 4.78 2.23 2.39 2.26 2.57 SPARKS NV 2439 1/2 1.45 n/a 12 n/a 7/a PARSIPPANY NJ 355 n/a 1.62 1.36 1.39 1.03 1.76 EFFINGHAM IL 570 0.87 0.87 1.25 0.87 09 1.31 KEARNY NJ 324 n/a 2.01 1.54 1.53 1.28 1.95 Available Pulls: 4 8 7 7 3 4 Commitment: 1 7 6 0 0 4
Step by Step Solution
There are 3 Steps involved in it
Step: 1
To optimize the truckloads assignment problem using Excel you can follow these steps to create a spreadsheet model Step 1 Data Entry Enter the given d...
Get Instant Access to Expert-Tailored Solutions
See step-by-step solutions with expert insights and AI powered tools for academic success
Step: 2

Step: 3

Ace Your Homework with AI
Get the answers you need in no time with our AI-driven, step-by-step assistance
Get Started


