** make sure the Q ask for depreciated using the MACRS
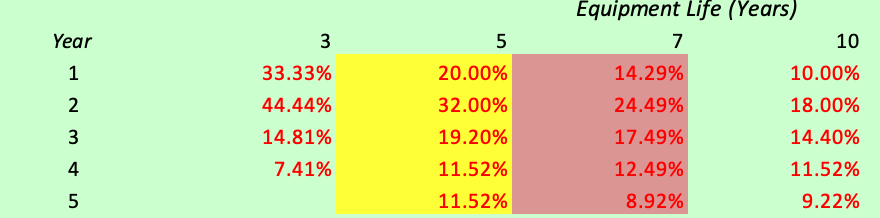
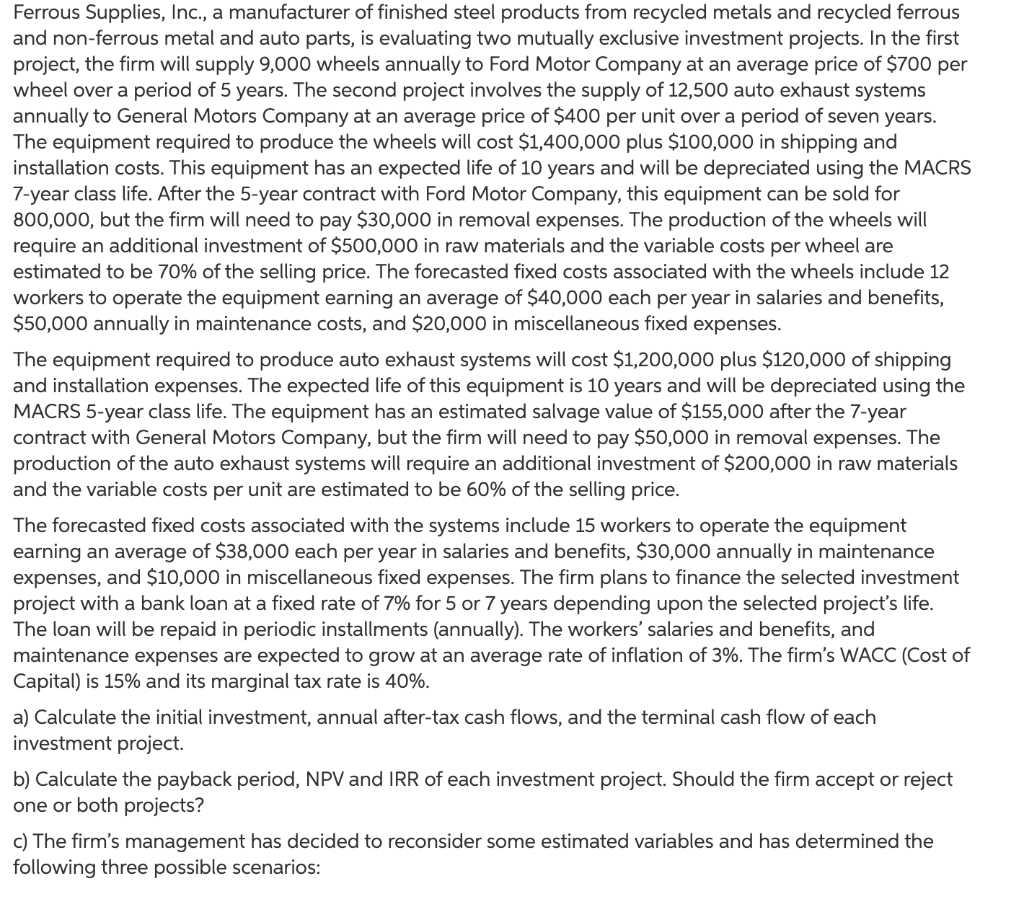
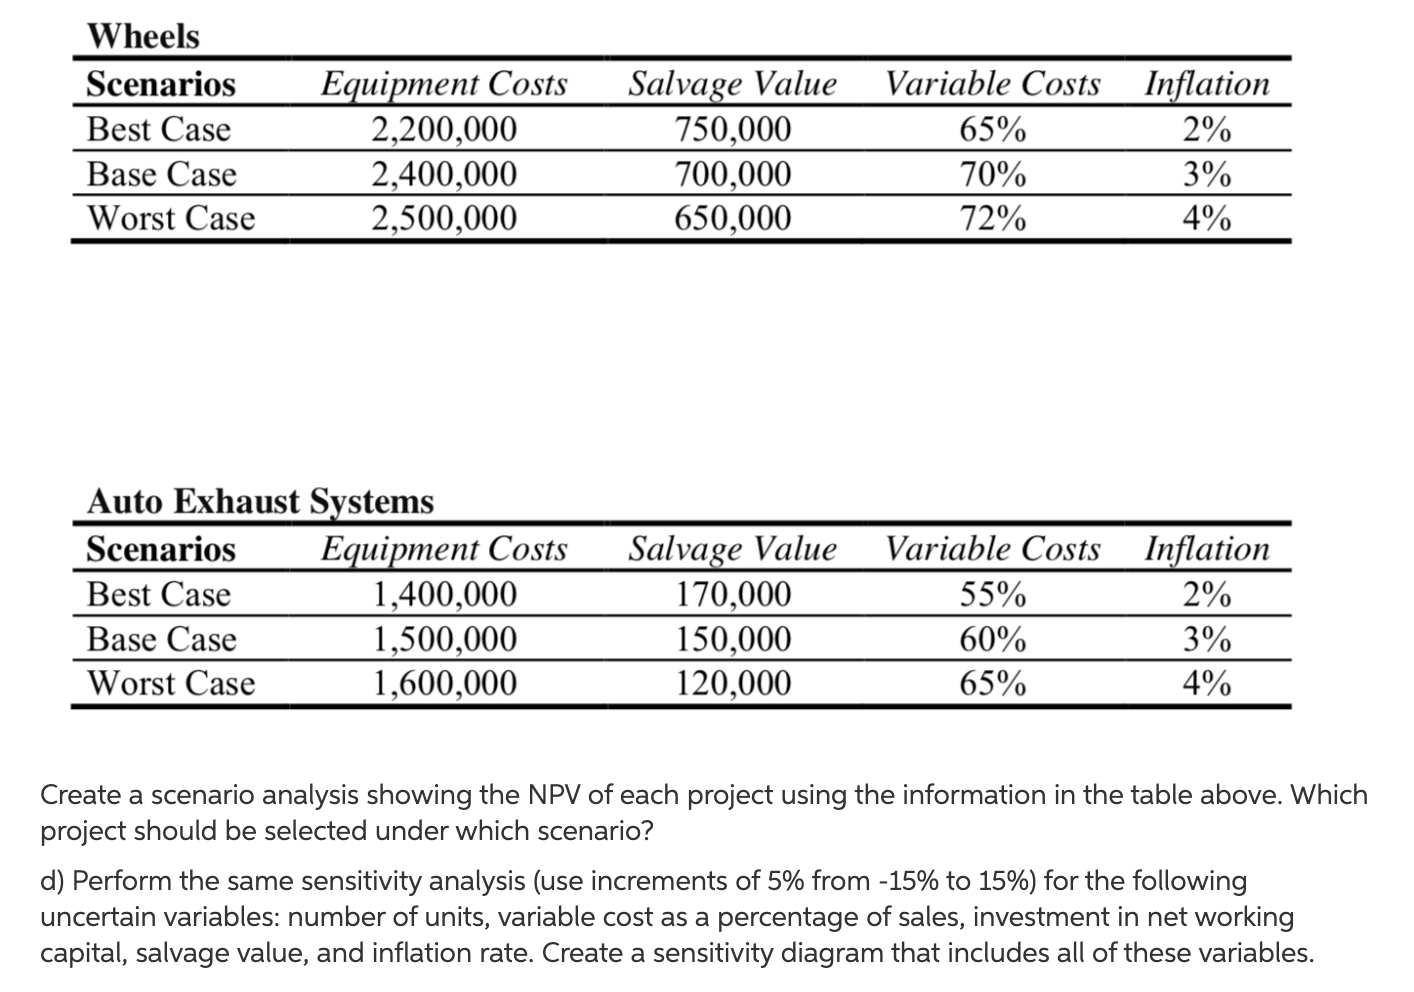
Ferrous Supplies, Inc., a manufacturer of finished steel products from recycled metals and recycled ferrous and non-ferrous metal and auto parts, is evaluating two mutually exclusive investment projects. In the first project, the firm will supply 9,000 wheels annually to Ford Motor Company at an average price of $700 per wheel over a period of 5 years. The second project involves the supply of 12,500 auto exhaust systems annually to General Motors Company at an average price of $400 per unit over a period of seven years. The equipment required to produce the wheels will cost $1,400,000 plus $100,000 in shipping and installation costs. This equipment has an expected life of 10 years and will be depreciated using the MACRS 7-year class life. After the 5-year contract with Ford Motor Company, this equipment can be sold for 800,000, but the firm will need to pay $30,000 in removal expenses. The production of the wheels will require an additional investment of $500,000 in raw materials and the variable costs per wheel are estimated to be 70% of the selling price. The forecasted fixed costs associated with the wheels include 12 workers to operate the equipment earning an average of $40,000 each per year in salaries and benefits, $50,000 annually in maintenance costs, and $20,000 in miscellaneous fixed expenses. The equipment required to produce auto exhaust systems will cost $1,200,000 plus $120,000 of shipping and installation expenses. The expected life of this equipment is 10 years and will be depreciated using the MACRS 5-year class life. The equipment has an estimated salvage value of $155,000 after the 7-year contract with General Motors Company, but the firm will need to pay $50,000 in removal expenses. The production of the auto exhaust systems will require an additional investment of $200,000 in raw materials and the variable costs per unit are estimated to be 60% of the selling price. The forecasted fixed costs associated with the systems include 15 workers to operate the equipment earning an average of $38,000 each per year in salaries and benefits, $30,000 annually in maintenance expenses, and $10,000 in miscellaneous fixed expenses. The firm plans to finance the selected investment project with a bank loan at a fixed rate of 7% for 5 or 7 years depending upon the selected project's life. The loan will be repaid in periodic installments (annually). The workers' salaries and benefits, and maintenance expenses are expected to grow at an average rate of inflation of 3%. The firm's WACC (Cost of Capital) is 15% and its marginal tax rate is 40%. a) Calculate the initial investment, annual after-tax cash flows, and the terminal cash flow of each investment project. b) Calculate the payback period, NPV and IRR of each investment project. Should the firm accept or reject one or both projects? c) The firm's management has decided to reconsider some estimated variables and has determined the following three possible scenarios: Wheels Scenarios Best Case Base Case Worst Case Equipment Costs 2,200,000 2,400,000 2,500,000 Salvage Value 750,000 700,000 650,000 Variable Costs 65% 70% 72% Inflation 2% 3% 4% Variable Costs Inflation Auto Exhaust Systems Scenarios Equipment Costs Best Case 1,400,000 Base Case 1,500,000 Worst Case 1,600,000 55% 2% Salvage Value 170,000 150,000 120,000 60% 65% 3% 4% Create a scenario analysis showing the NPV of each project using the information in the table above. Which project should be selected under which scenario? d) Perform the same sensitivity analysis (use increments of 5% from -15% to 15%) for the following uncertain variables: number of units, variable cost as a percentage of sales, investment in net working capital, salvage value, and inflation rate. Create a sensitivity diagram that includes all of these variables. Equipment Life (Years) 10 33.33% 44.44% 14.81% 7.41% 20.00% 32.00% 19.20% 11.52% 11.52% 14.29% 24.49% 17.49% 12.49% 8.92% 10.00% 18.00% 14.40% 11.52% 9.22% Ferrous Supplies, Inc., a manufacturer of finished steel products from recycled metals and recycled ferrous and non-ferrous metal and auto parts, is evaluating two mutually exclusive investment projects. In the first project, the firm will supply 9,000 wheels annually to Ford Motor Company at an average price of $700 per wheel over a period of 5 years. The second project involves the supply of 12,500 auto exhaust systems annually to General Motors Company at an average price of $400 per unit over a period of seven years. The equipment required to produce the wheels will cost $1,400,000 plus $100,000 in shipping and installation costs. This equipment has an expected life of 10 years and will be depreciated using the MACRS 7-year class life. After the 5-year contract with Ford Motor Company, this equipment can be sold for 800,000, but the firm will need to pay $30,000 in removal expenses. The production of the wheels will require an additional investment of $500,000 in raw materials and the variable costs per wheel are estimated to be 70% of the selling price. The forecasted fixed costs associated with the wheels include 12 workers to operate the equipment earning an average of $40,000 each per year in salaries and benefits, $50,000 annually in maintenance costs, and $20,000 in miscellaneous fixed expenses. The equipment required to produce auto exhaust systems will cost $1,200,000 plus $120,000 of shipping and installation expenses. The expected life of this equipment is 10 years and will be depreciated using the MACRS 5-year class life. The equipment has an estimated salvage value of $155,000 after the 7-year contract with General Motors Company, but the firm will need to pay $50,000 in removal expenses. The production of the auto exhaust systems will require an additional investment of $200,000 in raw materials and the variable costs per unit are estimated to be 60% of the selling price. The forecasted fixed costs associated with the systems include 15 workers to operate the equipment earning an average of $38,000 each per year in salaries and benefits, $30,000 annually in maintenance expenses, and $10,000 in miscellaneous fixed expenses. The firm plans to finance the selected investment project with a bank loan at a fixed rate of 7% for 5 or 7 years depending upon the selected project's life. The loan will be repaid in periodic installments (annually). The workers' salaries and benefits, and maintenance expenses are expected to grow at an average rate of inflation of 3%. The firm's WACC (Cost of Capital) is 15% and its marginal tax rate is 40%. a) Calculate the initial investment, annual after-tax cash flows, and the terminal cash flow of each investment project. b) Calculate the payback period, NPV and IRR of each investment project. Should the firm accept or reject one or both projects? c) The firm's management has decided to reconsider some estimated variables and has determined the following three possible scenarios: Wheels Scenarios Best Case Base Case Worst Case Equipment Costs 2,200,000 2,400,000 2,500,000 Salvage Value 750,000 700,000 650,000 Variable Costs 65% 70% 72% Inflation 2% 3% 4% Variable Costs Inflation Auto Exhaust Systems Scenarios Equipment Costs Best Case 1,400,000 Base Case 1,500,000 Worst Case 1,600,000 55% 2% Salvage Value 170,000 150,000 120,000 60% 65% 3% 4% Create a scenario analysis showing the NPV of each project using the information in the table above. Which project should be selected under which scenario? d) Perform the same sensitivity analysis (use increments of 5% from -15% to 15%) for the following uncertain variables: number of units, variable cost as a percentage of sales, investment in net working capital, salvage value, and inflation rate. Create a sensitivity diagram that includes all of these variables. Equipment Life (Years) 10 33.33% 44.44% 14.81% 7.41% 20.00% 32.00% 19.20% 11.52% 11.52% 14.29% 24.49% 17.49% 12.49% 8.92% 10.00% 18.00% 14.40% 11.52% 9.22%