

Question
Managerial Accounting Analysis. 1) Answer the following questions using the following company statements CASH FLOWS BALANCE SHEETS INCOME STATEMENTS SHAREHOLDERS EQUITY a. Were there any
Managerial Accounting Analysis.
1) Answer the following questions using the following company statements
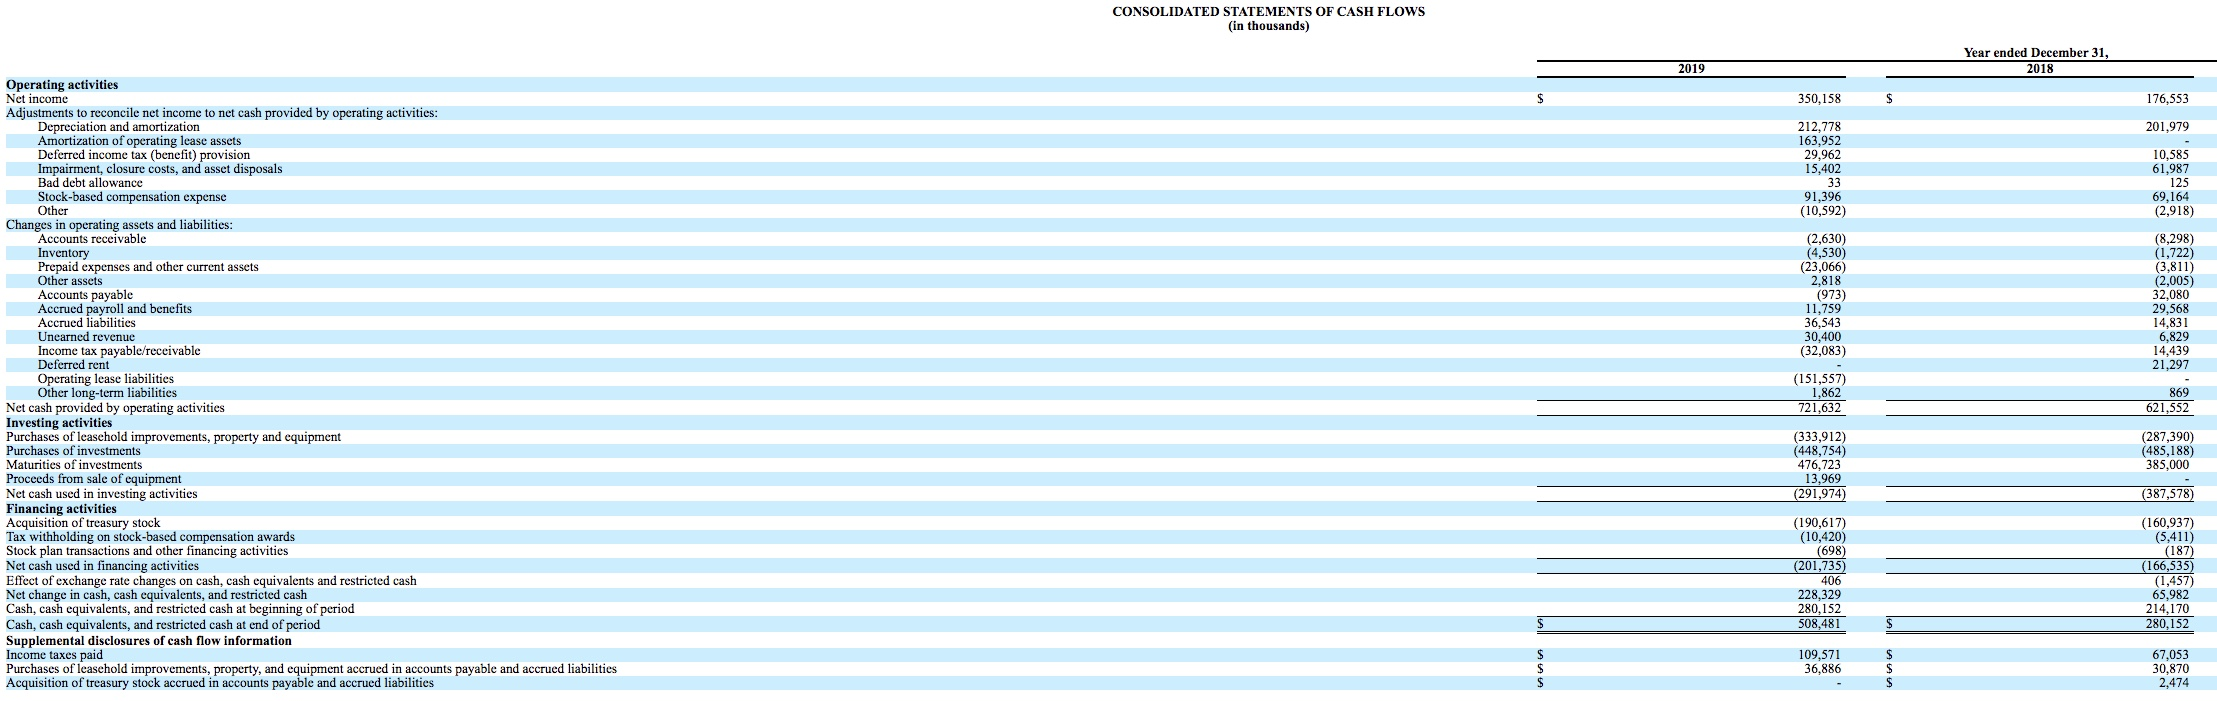
CASH FLOWS
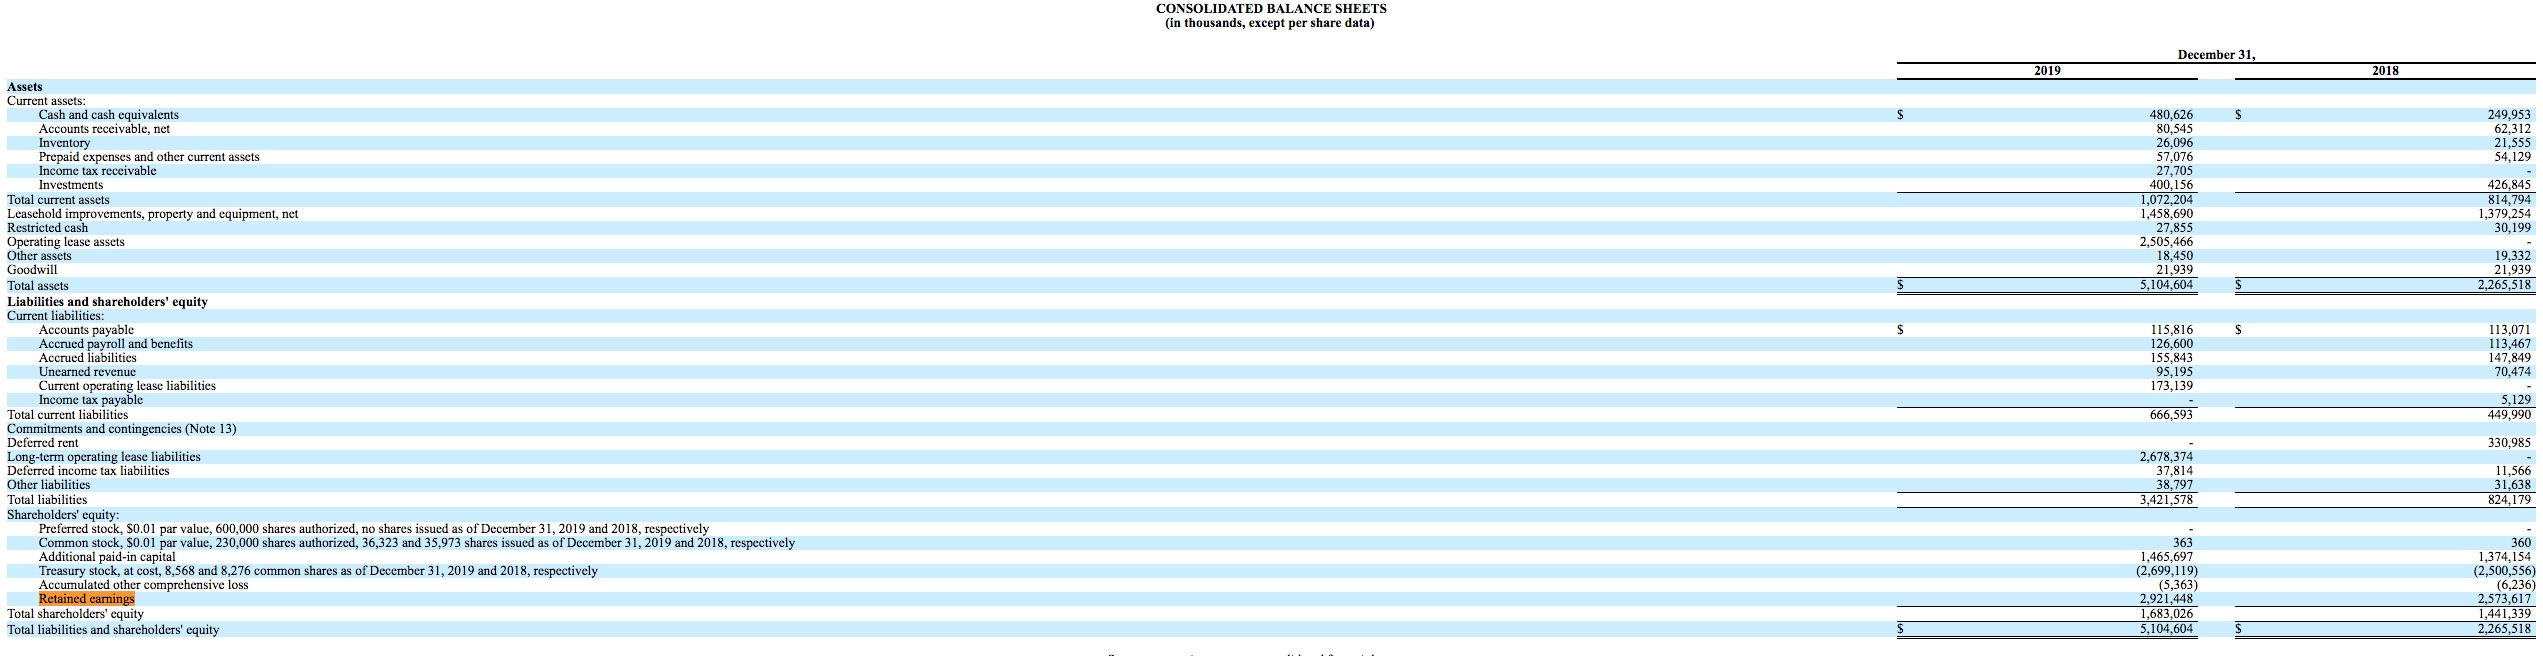
BALANCE SHEETS
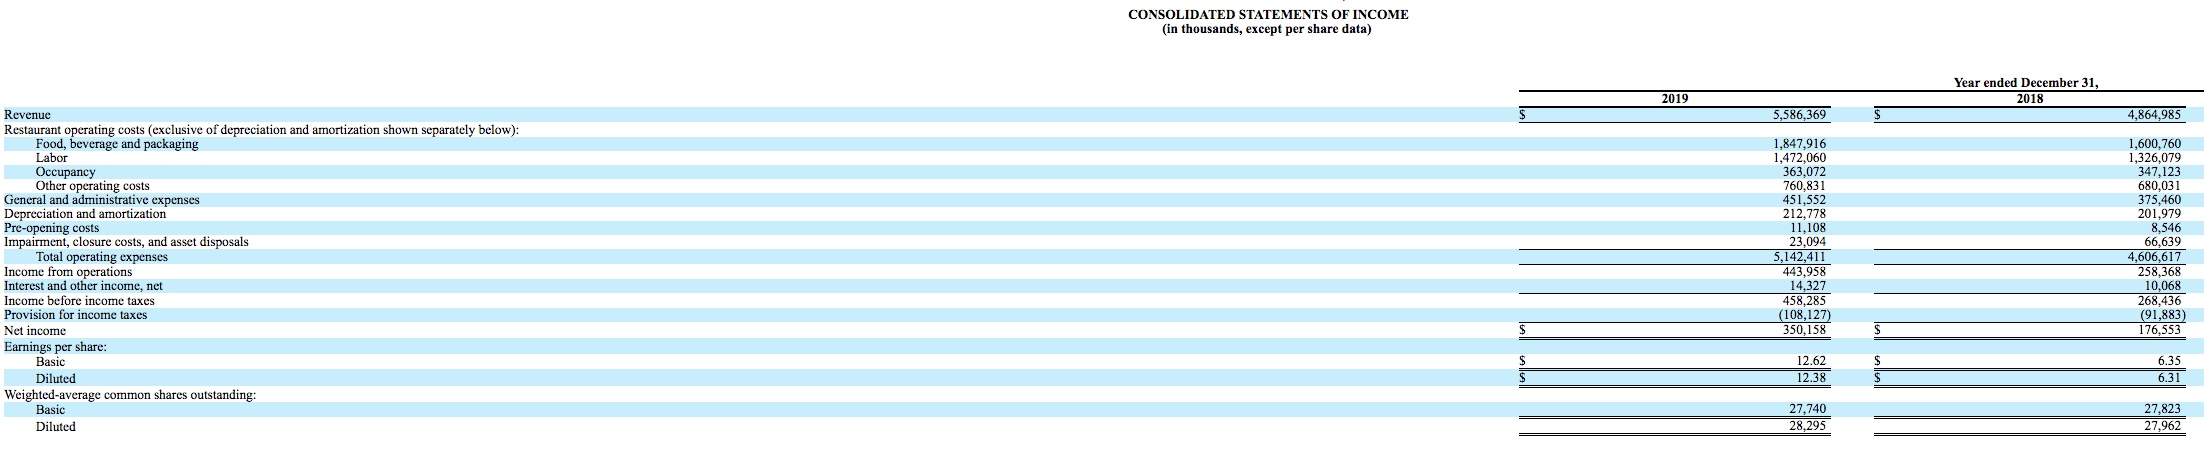
INCOME STATEMENTS
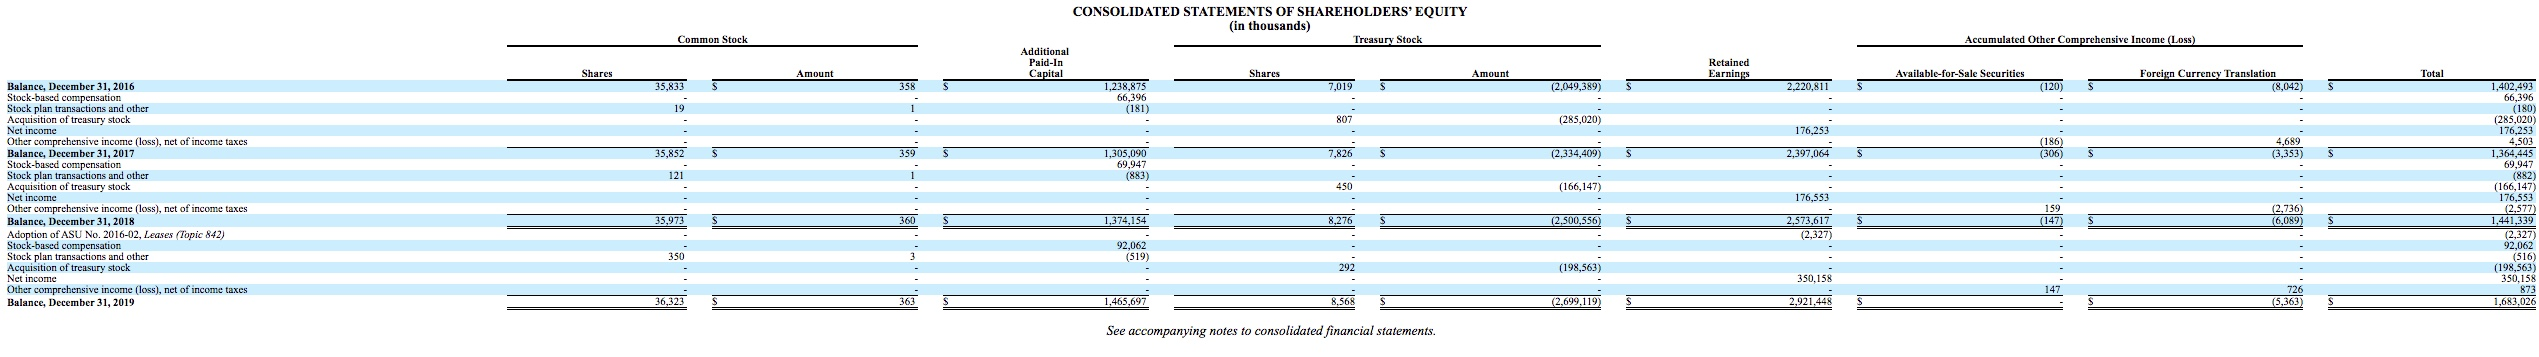
SHAREHOLDERS EQUITY
a. Were there any Non-Cash Investing/Financing Transactions? Describe the type and amount.
b. What is the dollar difference between accrual net income and Cash provided by Operations?
c. What investing activity provided the largest inflow of cash in the current year?
d. What investing activity used the largest amount of cash in the current year?
e. What financing activity provided the largest inflow of cash in the current year?
f. What financing activity used the largest amount of cash in the current year?
g. Does the company have sufficient cash inflows from the appropriate category? Describe any problems the company many experience with cash flow from your analysis of the cash flow statement.
h. Show the change in Retained Earnings for the 2 most recent years. What was net income for each year? How much was paid out in dividends each year?
i. Were the dividends on common stock and/or preferred stock? What was the amount of each?
j. Did Retained Earnings change for any reasons other than net income or dividends? Explain.
k. What classes of stock does your company have?
l. How many shares of each class of stock are authorized, how many are issued, and how many are outstanding?
m. Does your company have any treasury stock? How many shares and what dollar amount?
n. What is the par or stated value of each of your companys stocks?
CONSOLIDATED STATEMENTS OF CASH FLOWS (in thousands) Year ended December 31, 2018 2019 $ 350,158 A 176,553 201,979 212.778 163,952 29.962 15,402 33 91,396 (10,592) 10.585 61,987 125 69,164 (2,918) (2,630) (4,530) (23,066) 2.818 (973) 11,759 36,543 30,400 (32,083) (8,298) (1,722) (3,811) (2,005) 32,080 29,568 14.831 6,829 14,439 21,297 Operating activities Net income Adjustments to reconcile net income to net cash provided by operating activities: Depreciation and amortization Amortization of operating lease assets Deferred income tax (benefit) provision Impairment, closure costs, and asset disposals Bad debt allowance Stock-based compensation expense Other Changes in operating assets and liabilities: Accounts receivable Inventory Prepaid expenses and other current assets Other assets Accounts payable Accrued payroll and benefits Accrued liabilities Unearned revenue Income tax payable/receivable Deferred rent Operating lease liabilities Other long-term liabilities Net cash provided by operating activities Investing activities Purchases of leasehold improvements, property and equipment Purchases of investments Maturities of investments Proceeds from sale of equipment Net cash used in investing activities Financing activities Acquisition of treasury stock Tax withholding on stock-based compensation awards Stock plan transactions and other financing activities Net cash used in financing activities Effect of exchange rate changes on cash, cash equivalents and restricted cash Net change in cash, cash equivalents, and restricted cash Cash, cash equivalents, and restricted cash at beginning of period Cash, cash equivalents, and restricted cash at end of period Supplemental disclosures of cash flow information Income taxes paid Purchases of leasehold improvements, property, and equipment accrued in accounts payable and accrued liabilities Acquisition of treasury stock accrued in accounts payable and accrued liabilities (151,557) 1,862 721,632 869 621,552 (333,912) (448,754) 476.723 13,969 (291,974) (287,390) (485,188) 385,000 (387,578) (190,617) (10,420) (698) (201,735) 406 228,329 280.152 508,481 (160,937) (5,411) (187) (166,535) (1,457) 65,982 214,170 280,152 $ 109,571 36,886 67,053 30,870 2,474 $ $ CONSOLIDATED BALANCE SHEETS (in thousands, except per share data) December 31, 2019 2018 S 249,953 62,312 21,555 54.129 480,626 80,545 26,096 57,076 27,705 400.156 1,072,204 1,458,690 27,855 2,505,466 18,450 21,939 5,104,604 426,845 814,794 1,379,254 30,199 19,332 21.939 2.265.518 S $ Assets Current assets: Cash and cash equivalents Accounts receivable, net Inventory Prepaid expenses and other current assets Income tax receivable Investments Total current assets Leasehold improvements, property and equipment, net Restricted cash Operating lease assets Other assets Goodwill Total assets Liabilities and shareholders' equity Current liabilities: Accounts payable Accrued payroll and benefits Accrued liabilities Unearned revenue Current operating lease liabilities Income tax payable Total current liabilities Commitments and contingencies (Note 13) Deferred rent Long-term operating lease liabilities Deferred income tax liabilities Other liabilities Total liabilities Shareholders' equity: Preferred stock, 30.01 par value, 600,000 shares authorized, no shares issued as of December 31, 2019 and 2018, respectively Common stock, S0.01 par value, 230,000 shares authorized, 36,323 and 35,973 shares issued as of December 31, 2019 and 2018, respectively Additional paid-in capital Treasury stock, at cost, 8,568 and 8,276 common shares as of December 31, 2019 and 2018, respectively Accumulated other comprehensive loss Retained earnings Total shareholders' equity Total liabilities and shareholders' equity 115,816 126,600 155.843 95,195 173,139 113,071 113,467 147,849 70,474 666,593 5,129 449,990 330,985 2,678,374 37,814 38,797 3,421,578 11.566 31,638 824,179 363 1,465,697 (2,699,119) (5,363) 2,921,448 1,683,026 5,104,604 360 1,374,154 (2,500,556) (6,236) 2,573,617 1,441,339 2,265,518 CONSOLIDATED STATEMENTS OF INCOME (in thousands, except per share data) Year ended December 31, 2018 2019 5,586,369 4,864,985 Revenue Restaurant operating costs (exclusive of depreciation and amortization shown separately below): Food, beverage and packaging Labor Occupancy Other operating costs General and administrative expenses Depreciation and amortization Pre-opening costs Impairment, closure costs, and asset disposals Total operating expenses Income from operations Interest and other income, net Income before income taxes Provision for income taxes Net income Earnings per share: Basic 1,847,916 1,472,060 363,072 760,831 451,552 212,778 11,108 23,094 5,142,411 443,958 14.327 458.285 (108,127) 350,158 1,600,760 1,326.079 347,123 680.031 375,460 201,979 8,546 66,639 4,606,617 258.368 10,068 268,436 (91,883) 176,553 12.62 Diluted 6.35 6.31 12.38 Weighted average common shares outstanding: Basic Diluted 27,740 28,295 27,823 27,962 Common Stock Accumulated Other Comprehensive Income (Loss) CONSOLIDATED STATEMENTS OF SHAREHOLDERS' EQUITY (in thousands) Treasury Stock Additional Paid-In Capital Shares Amount 1,238.875 7,019 S 66,396 (181) 807 Shares Retained Earnings Amount Available-for-Sale Securities Total Foreign Currency Translation (8,042) 35,833 358 (2.049,389) S 2,220,811 S (120) S - 19 (285,020) 176,253 - - 35,852 359 7,826 (2,334,409) 2,397,064 (186) (306) 4,689 (3,353) 1,305,090 69,947 (883) 121 450 (166,147) Balance, December 31, 2016 Stock-based compensation Stock plan transactions and other Acquisition of treasury stock Net income Other comprehensive income (loss), net of income taxes Balance, December 31, 2017 Stock-based compensation Stock plan transactions and other Acquisition of treasury stock Net income Other comprehensive income (loss), net of income taxes Balance, December 31, 2018 Adoption of ASU No. 2016-02, Leases (Topic 842) Stock-based compensation Stock plan transactions and other Acquisition of treasury stock Net income Other comprehensive income (loss), net of income taxes Balance, December 31, 2019 176,553 1,402,493 66,396 (180) (285,020) 176,253 4,503 1,364,445 69,947 (882) (166,147) 176,553 (2,577) 1,441,339 (2,327) 92,062 (516) (198,563) 350,158 873 1,683,026 35,973 1,374,154 159 (147 360 8.276 (2.500,556) (2,736) (6,089) 2,573,617 (2,327) 350 92,062 (519) 292 (198,563) 350.158 147 36,323 363 S 1,465,697 8,568 (2.699.119) 726 (5,363) 2,921,448 S See accompanying notes to consolidated financial statementsStep by Step Solution
There are 3 Steps involved in it
Step: 1

Get Instant Access to Expert-Tailored Solutions
See step-by-step solutions with expert insights and AI powered tools for academic success
Step: 2

Step: 3
Ace Your Homework with AI
Get the answers you need in no time with our AI-driven, step-by-step assistance
Get Started
The Quality Audit Handbook
Authors: Asq Quality Audit Division, J. P. Russell
2nd Edition
087389460X, 978-0873894609