Question: Managerial Finance FIN 320 Homework Assignment 1 Financial Statement Analysis Learning Objectives & Instructions This assignment is intended to give you a practical application of
Managerial Finance FIN 320 Homework Assignment 1 Financial Statement Analysis
Learning Objectives & Instructions
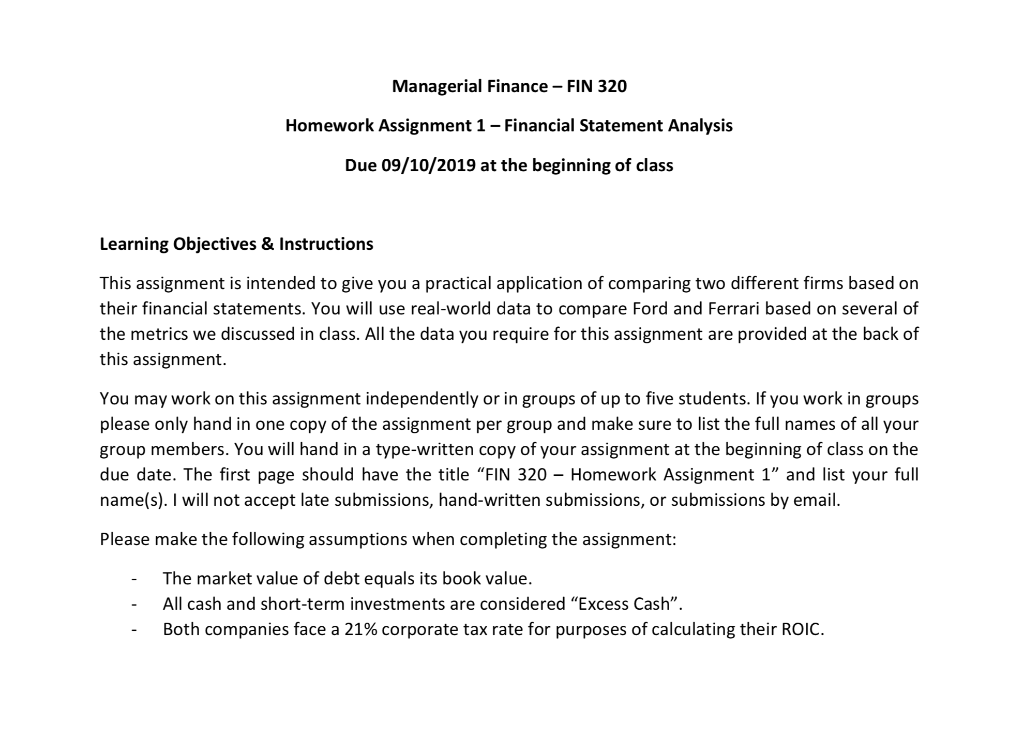
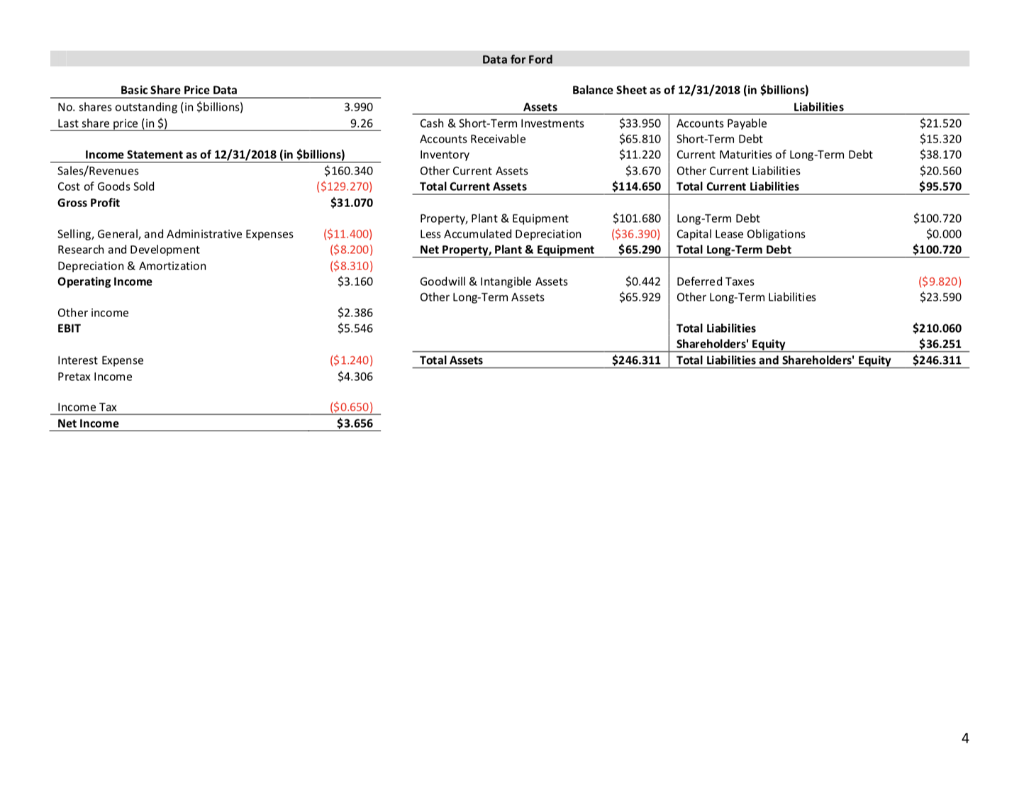
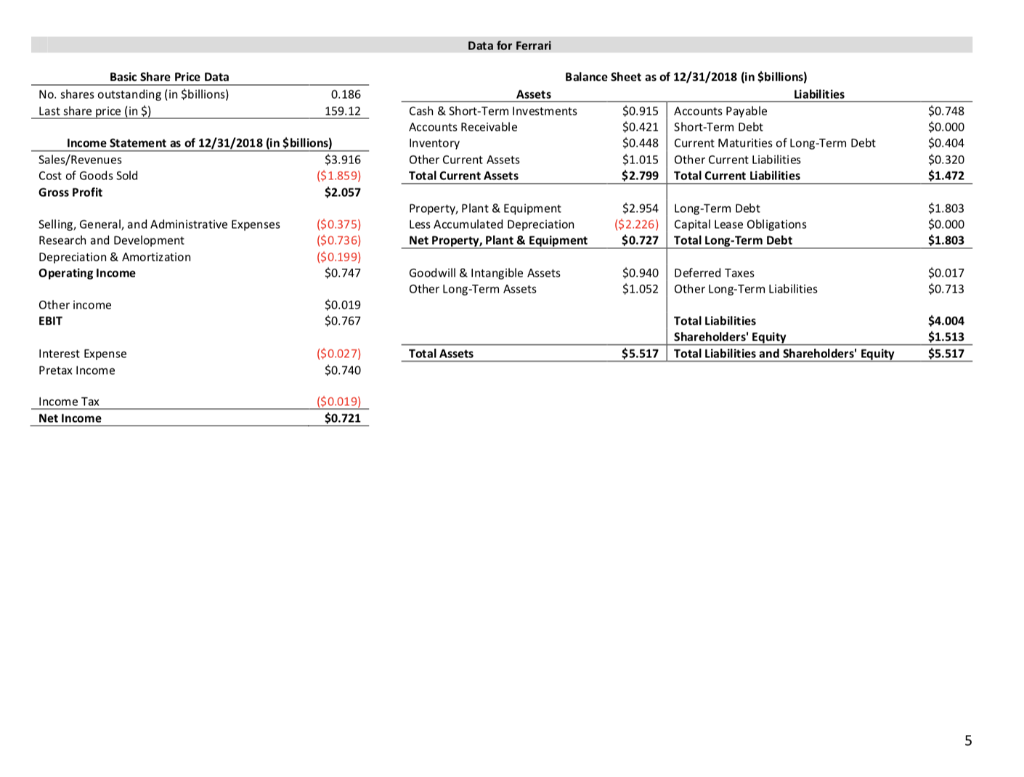
This assignment is intended to give you a practical application of comparing two different firms based on their financial statements. You will use real-world data to compare Ford and Ferrari based on several of the metrics we discussed in class. All the data you require for this assignment are provided at the back of this assignment.
You may work on this assignment independently or in groups of up to five students. If you work in groups please only hand in one copy of the assignment per group and make sure to list the full names of all your group members. You will hand in a type-written copy of your assignment at the beginning of class on the due date. The first page should have the title FIN 320 Homework Assignment 1 and list your full name(s). I will not accept late submissions, hand-written submissions, or submissions by email.
Please make the following assumptions when completing the assignment:
-
- The market value of debt equals its book value.
-
- All cash and short-term investments are considered Excess Cash.
-
- Both companies face a 21% corporate tax rate for purposes of calculating their ROIC.
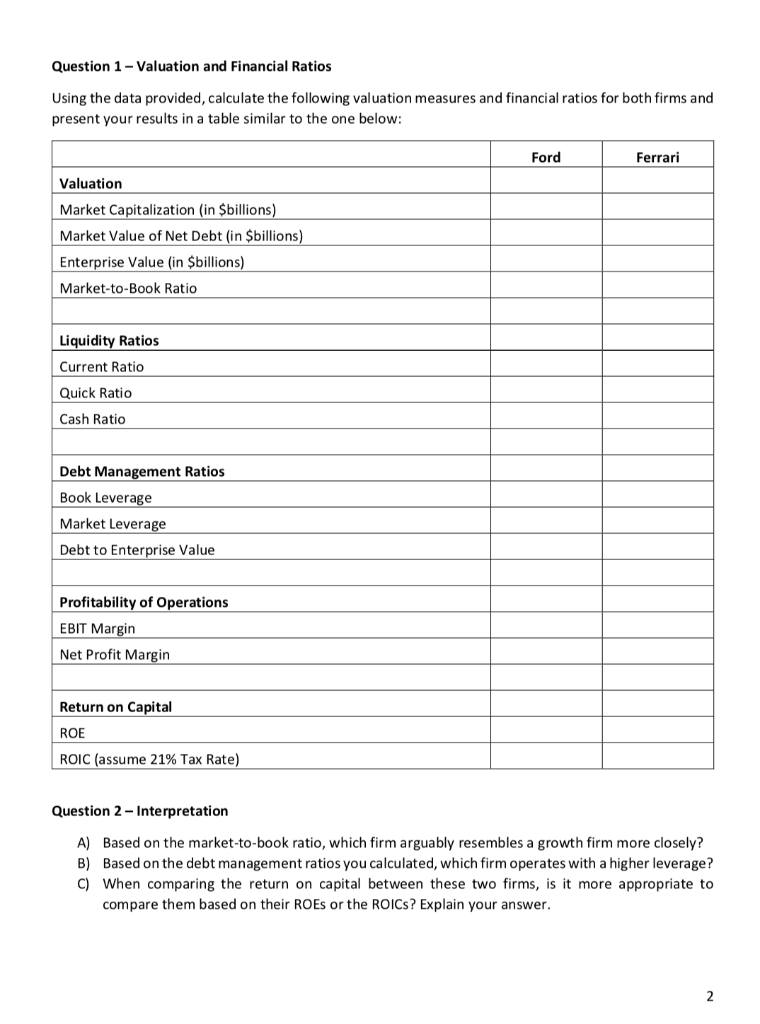
Question 1 Valuation and Financial Ratios
Using the data provided, calculate the following valuation measures and financial ratios for both firms and present your results in a table similar to the one below:
Question 2 Interpretation
A) Based on the market-to-book ratio, which firm arguably resembles a growth firm more closely?
B) Based on the debt management ratios you calculated, which firm operates with a higher leverage?
C) When comparing the return on capital between these two firms, is it more appropriate to
compare them based on their ROEs or the ROICs? Explain your answer.
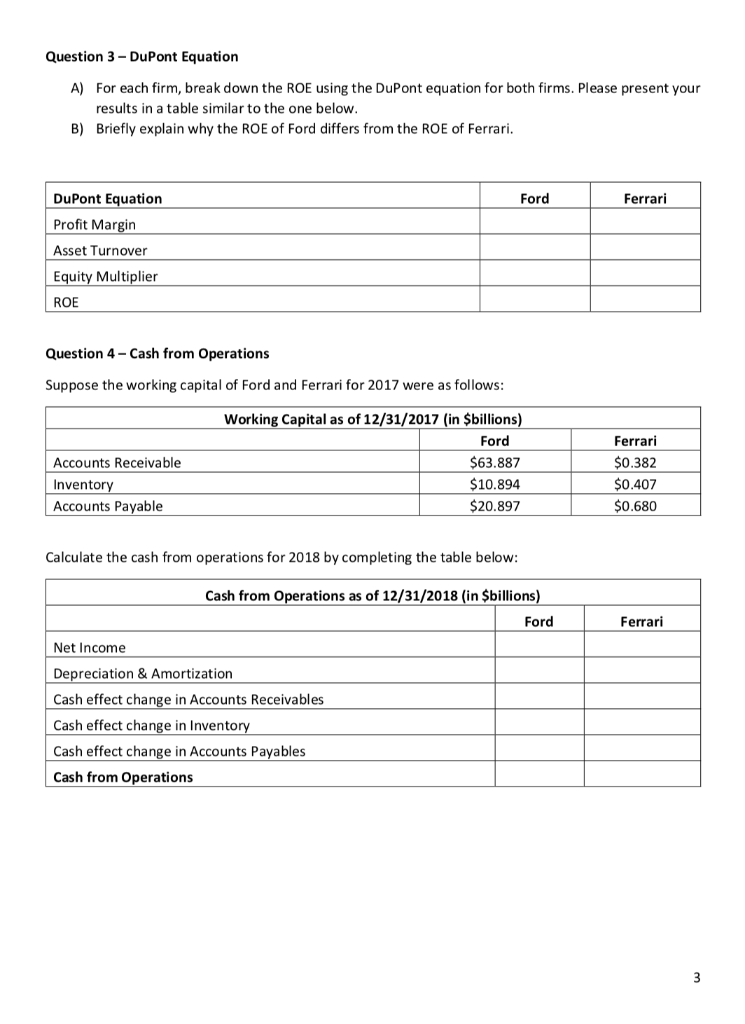
Question 3 DuPont Equation
A) For each firm, break down the ROE using the DuPont equation for both firms. Please present your results in a table similar to the one below.
B) Briefly explain why the ROE of Ford differs from the ROE of Ferrari.
Question 4 Cash from Operations
Suppose the working capital of Ford and Ferrari for 2017 were as follows:
Managerial Finance - FIN 320 Homework Assignment 1 - Financial Statement Analysis Due 09/10/2019 at the beginning of class Learning Objectives & Instructions This assignment is intended to give you a practical application of comparing two different firms based on their financial statements. You will use real-world data to compare Ford and Ferrari based on several of the metrics we discussed in class. All the data you require for this assignment are provided at the back of this assignment. You may work on this assignment independently or in groups of up to five students. If you work in groups please only hand in one copy of the assignment per group and make sure to list the full names of all your group members. You will hand in a type-written copy of your assignment at the beginning of class on the due date. The first page should have the title "FIN 320 - Homework Assignment 1" and list your full name(s). I will not accept late submissions, hand-written submissions, or submissions by email. Please make the following assumptions when completing the assignment: - - The market value of debt equals its book value. All cash and short-term investments are considered "Excess Cash". Both companies face a 21% corporate tax rate for purposes of calculating their ROIC. Question 1 - Valuation and Financial Ratios Using the data provided, calculate the following valuation measures and financial ratios for both firms and present your results in a table similar to the one below: Ford Ferrari Valuation Market Capitalization (in $billions) Market Value of Net Debt (in $billions) Enterprise Value (in $billions) Market-to-Book Ratio Liquidity Ratios Current Ratio Quick Ratio Cash Ratio Debt Management Ratios Book Leverage Market Leverage Debt to Enterprise Value Profitability of Operations EBIT Margin Net Profit Margin Return on Capital ROE ROIC (assume 21% Tax Rate) Question 2 - Interpretation A) Based on the market-to-book ratio, which firm arguably resembles a growth firm more closely? B) Based on the debt management ratios you calculated, which firm operates with a higher leverage? C) When comparing the return on capital between these two firms, is it more appropriate to compare them based on their ROEs or the ROICs? Explain your answer. Question 3 - DuPont Equation A) For each firm, break down the ROE using the DuPont equation for both firms. Please present your results in a table similar to the one below. B) Briefly explain why the ROE of Ford differs from the ROE of Ferrari. Ford Ferrari DuPont Equation Profit Margin Asset Turnover Equity Multiplier ROE Question 4 - Cash from Operations Suppose the working capital of Ford and Ferrari for 2017 were as follows: Accounts Receivable Inventory Accounts Payable Working Capital as of 12/31/2017 (in $billions) Ford $63.887 $10.894 $20.897 Ferrari $0.382 $0.407 $0.680 Calculate the cash from operations for 2018 by completing the table below: Cash from Operations as of 12/31/2018 (in $billions) Ford Ferrari Net Income Depreciation & Amortization Cash effect change in Accounts Receivables Cash effect change in Inventory Cash effect change in Accounts Payables Cash from Operations Data for Ford Basic Share Price Data No. shares outstanding (in Sbillions) Last share price (in $) 3.990 9.26 Balance Sheet as of 12/31/2018 (in $billions) Assets Liabilities Cash & Short-Term Investments $33.950 Accounts Payable Accounts Receivable $65.810 Short-Term Debt Inventory $11.220 Current Maturities of Long-Term Debt Other Current Assets $3.670 Other Current Liabilities Total Current Assets $114.650 Total Current Liabilities Income Statement as of 12/31/2018 (in $billions) Sales/Revenues $160.340 Cost of Goods Sold ($129.270) Gross Profit $31.070 $21.520 $15.320 $38.170 $20.560 $95.570 Property, Plant & Equipment Less Accumulated Depreciation Net Property, Plant & Equipment $101.680 ($36.390) $65.290 Long-Term Debt Capital Lease Obligations Total Long-Term Debt $100.720 $0.000 $100.720 Selling, General, and Administrative Expenses Research and Development Depreciation & Amortization Operating Income ($11.400) ($8.200) ($8.310) $3.160 Goodwill & Intangible Assets Other Long-Term Assets $0.442 $65.929 Deferred Taxes Other Long-Term Liabilities ($9.820) $23.590 Other income EBIT $2.386 $5.546 Total Liabilities Shareholders' Equity Total Liabilities and Shareholders' Equity $210.060 $36.251 $246.311 Total Assets $246.311 Interest Expense Pretax Income ($1.240) $4.306 Income Tax Net Income ($0.650) $3.656 Data for Ferrari Basic Share Price Data No. shares outstanding (in $billions) Last share price in $) 0.186 159.12 Balance Sheet as of 12/31/2018 (in $billions) Assets Liabilities Cash & Short-Term Investments $0.915 Accounts Payable Accounts Receivable $0.421 Short-Term Debt Inventory $0.448 Current Maturities of Long-Term Debt Other Current Assets $1.015 Other Current Liabilities Total Current Assets $2.799 Total Current Liabilities Income Statement as of 12/31/2018 (in $billions) Sales/Revenues $3.916 Cost of Goods Sold ($1.859) Gross Profit $2.057 $0.748 $0.000 $0.404 $0.320 $1.472 Property, Plant & Equipment Less Accumulated Depreciation Net Property, Plant & Equipment $2.954 ($ 2.226) $0.727 Long-Term Debt Capital Lease Obligations Total Long-Term Debt $1.803 $0.000 $1.803 Selling, General, and Administrative Expenses Research and Development Depreciation & Amortization Operating Income ($0.375) ($0.736) ($0.199) $0.747 Goodwill & Intangible Assets Other Long-Term Assets $0.940 Deferred Taxes Other Long-Term Liabilities $0.017 $0.713 Other income EBIT $0.019 $0.767 Total Liabilities Shareholders' Equity Total Liabilities and Shareholders' Equity $4.004 $1.513 $5.517 Total Assets $5.517 Interest Expense Pretax Income ($0.027) $0.740 Income Tax Net Income ($0.019) $0.721 Managerial Finance - FIN 320 Homework Assignment 1 - Financial Statement Analysis Due 09/10/2019 at the beginning of class Learning Objectives & Instructions This assignment is intended to give you a practical application of comparing two different firms based on their financial statements. You will use real-world data to compare Ford and Ferrari based on several of the metrics we discussed in class. All the data you require for this assignment are provided at the back of this assignment. You may work on this assignment independently or in groups of up to five students. If you work in groups please only hand in one copy of the assignment per group and make sure to list the full names of all your group members. You will hand in a type-written copy of your assignment at the beginning of class on the due date. The first page should have the title "FIN 320 - Homework Assignment 1" and list your full name(s). I will not accept late submissions, hand-written submissions, or submissions by email. Please make the following assumptions when completing the assignment: - - The market value of debt equals its book value. All cash and short-term investments are considered "Excess Cash". Both companies face a 21% corporate tax rate for purposes of calculating their ROIC. Question 1 - Valuation and Financial Ratios Using the data provided, calculate the following valuation measures and financial ratios for both firms and present your results in a table similar to the one below: Ford Ferrari Valuation Market Capitalization (in $billions) Market Value of Net Debt (in $billions) Enterprise Value (in $billions) Market-to-Book Ratio Liquidity Ratios Current Ratio Quick Ratio Cash Ratio Debt Management Ratios Book Leverage Market Leverage Debt to Enterprise Value Profitability of Operations EBIT Margin Net Profit Margin Return on Capital ROE ROIC (assume 21% Tax Rate) Question 2 - Interpretation A) Based on the market-to-book ratio, which firm arguably resembles a growth firm more closely? B) Based on the debt management ratios you calculated, which firm operates with a higher leverage? C) When comparing the return on capital between these two firms, is it more appropriate to compare them based on their ROEs or the ROICs? Explain your answer. Question 3 - DuPont Equation A) For each firm, break down the ROE using the DuPont equation for both firms. Please present your results in a table similar to the one below. B) Briefly explain why the ROE of Ford differs from the ROE of Ferrari. Ford Ferrari DuPont Equation Profit Margin Asset Turnover Equity Multiplier ROE Question 4 - Cash from Operations Suppose the working capital of Ford and Ferrari for 2017 were as follows: Accounts Receivable Inventory Accounts Payable Working Capital as of 12/31/2017 (in $billions) Ford $63.887 $10.894 $20.897 Ferrari $0.382 $0.407 $0.680 Calculate the cash from operations for 2018 by completing the table below: Cash from Operations as of 12/31/2018 (in $billions) Ford Ferrari Net Income Depreciation & Amortization Cash effect change in Accounts Receivables Cash effect change in Inventory Cash effect change in Accounts Payables Cash from Operations Data for Ford Basic Share Price Data No. shares outstanding (in Sbillions) Last share price (in $) 3.990 9.26 Balance Sheet as of 12/31/2018 (in $billions) Assets Liabilities Cash & Short-Term Investments $33.950 Accounts Payable Accounts Receivable $65.810 Short-Term Debt Inventory $11.220 Current Maturities of Long-Term Debt Other Current Assets $3.670 Other Current Liabilities Total Current Assets $114.650 Total Current Liabilities Income Statement as of 12/31/2018 (in $billions) Sales/Revenues $160.340 Cost of Goods Sold ($129.270) Gross Profit $31.070 $21.520 $15.320 $38.170 $20.560 $95.570 Property, Plant & Equipment Less Accumulated Depreciation Net Property, Plant & Equipment $101.680 ($36.390) $65.290 Long-Term Debt Capital Lease Obligations Total Long-Term Debt $100.720 $0.000 $100.720 Selling, General, and Administrative Expenses Research and Development Depreciation & Amortization Operating Income ($11.400) ($8.200) ($8.310) $3.160 Goodwill & Intangible Assets Other Long-Term Assets $0.442 $65.929 Deferred Taxes Other Long-Term Liabilities ($9.820) $23.590 Other income EBIT $2.386 $5.546 Total Liabilities Shareholders' Equity Total Liabilities and Shareholders' Equity $210.060 $36.251 $246.311 Total Assets $246.311 Interest Expense Pretax Income ($1.240) $4.306 Income Tax Net Income ($0.650) $3.656 Data for Ferrari Basic Share Price Data No. shares outstanding (in $billions) Last share price in $) 0.186 159.12 Balance Sheet as of 12/31/2018 (in $billions) Assets Liabilities Cash & Short-Term Investments $0.915 Accounts Payable Accounts Receivable $0.421 Short-Term Debt Inventory $0.448 Current Maturities of Long-Term Debt Other Current Assets $1.015 Other Current Liabilities Total Current Assets $2.799 Total Current Liabilities Income Statement as of 12/31/2018 (in $billions) Sales/Revenues $3.916 Cost of Goods Sold ($1.859) Gross Profit $2.057 $0.748 $0.000 $0.404 $0.320 $1.472 Property, Plant & Equipment Less Accumulated Depreciation Net Property, Plant & Equipment $2.954 ($ 2.226) $0.727 Long-Term Debt Capital Lease Obligations Total Long-Term Debt $1.803 $0.000 $1.803 Selling, General, and Administrative Expenses Research and Development Depreciation & Amortization Operating Income ($0.375) ($0.736) ($0.199) $0.747 Goodwill & Intangible Assets Other Long-Term Assets $0.940 Deferred Taxes Other Long-Term Liabilities $0.017 $0.713 Other income EBIT $0.019 $0.767 Total Liabilities Shareholders' Equity Total Liabilities and Shareholders' Equity $4.004 $1.513 $5.517 Total Assets $5.517 Interest Expense Pretax Income ($0.027) $0.740 Income Tax Net Income ($0.019) $0.721
Step by Step Solution
There are 3 Steps involved in it

Get step-by-step solutions from verified subject matter experts


