

Question
Managerial Finance FIN 320 Homework Assignment 4 Estimating the Cost of Capital Due 10/22/2019 at the beginning of class Suppose that it is January 2019
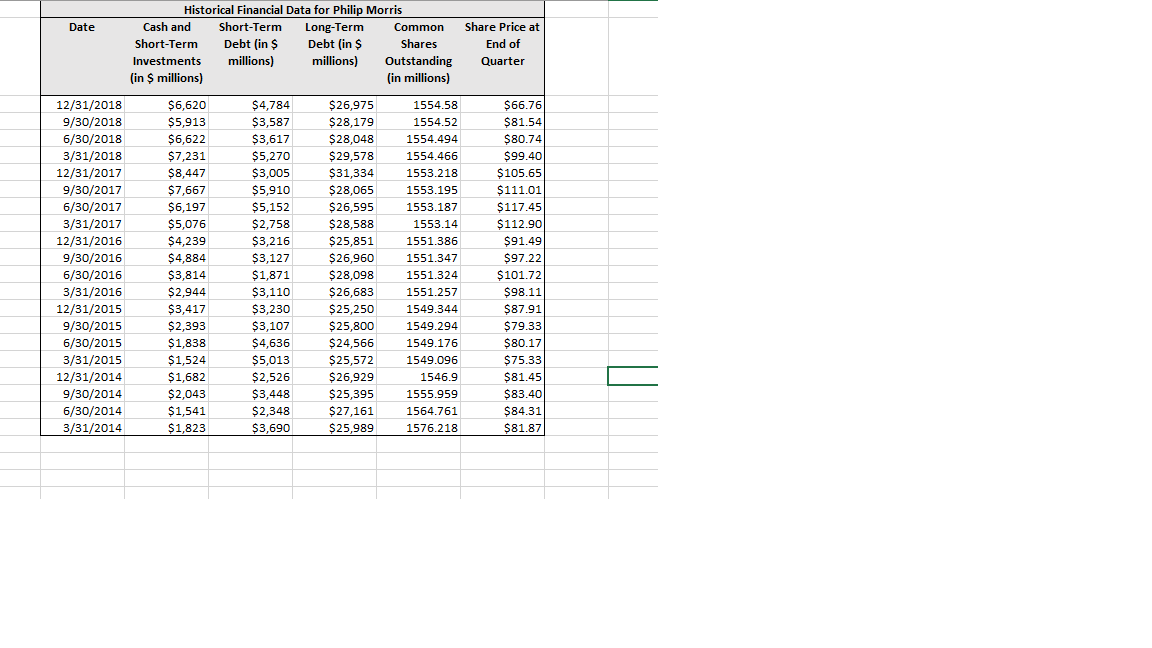
Managerial Finance FIN 320 Homework Assignment 4 Estimating the Cost of Capital Due 10/22/2019 at the beginning of class Suppose that it is January 2019 and you have been tasked with analyzing whether a long-term investment project proposed by the R&D team of Philp Morris International Inc. (Ticker: PM) will create value. The project has a length of 20 years after which it will be terminated. PM expects that there will be no further cash flows after 20 years. Your task is to come up with an estimate for the cost of capital of this project. Please make the following assumptions when completing the assignment: - Apply the CAPM to estimate the cost of equity (). - Use bond yields to estimate the cost of debt. - The market value of debt of PM equals the book value of debt (). - All cash and short-term investments are considered Excess Cash. - PM faces a corporate tax rate of 21%. - The market risk premium ([] ) is 5%. - The project is of average risk for PM. Question 1 Changes in Leverage at Philip Morris A) Using the financial data in the Excel file on Blackboard, provide a graph that displays the evolution of the Debt to Enterprise Value Ratio of PM from 2014 to 2018. (The x-axis should be the date, the y-axis should be the Debt to Enterprise Value Ratio). B) Briefly describe your findings from part (A).
Did the debt to enterprise value increase or decrease over time?
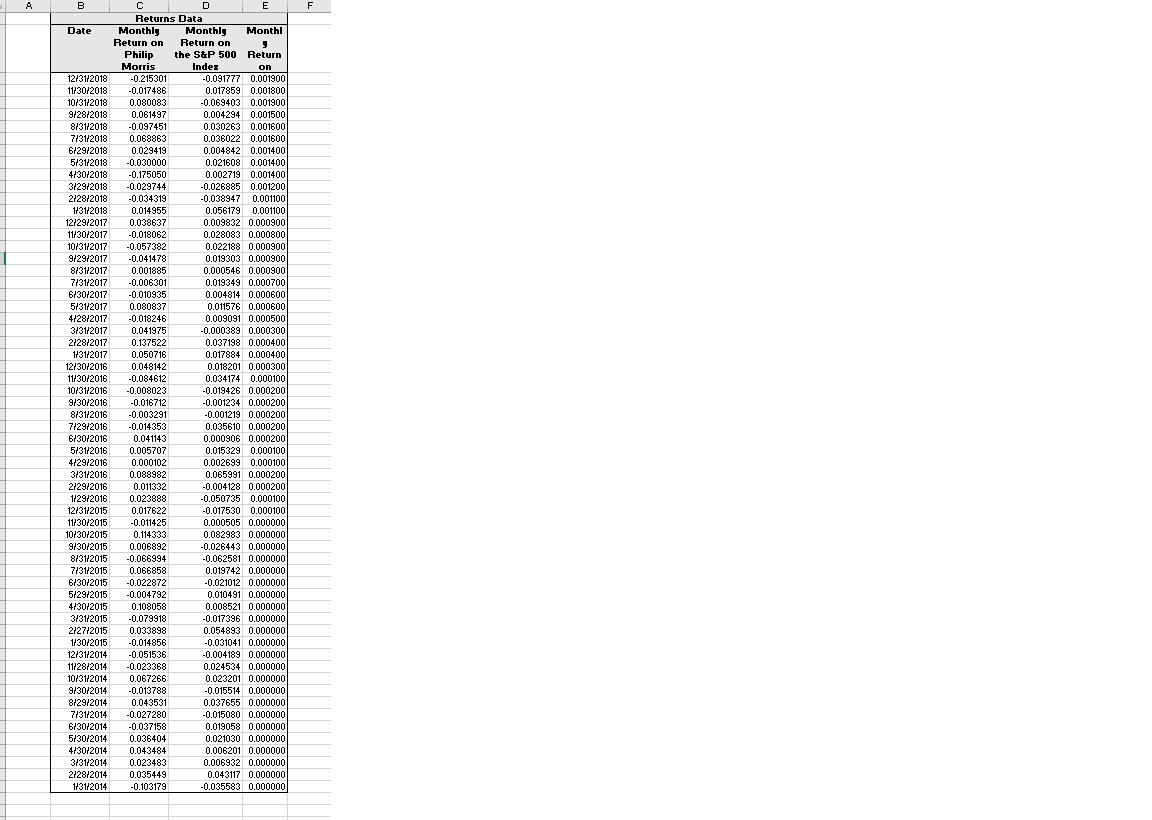
Question 2 Estimate the Beta for the Cost of Equity Using the financial data in the Excel file on Blackboard, provide a graph that displays excess monthly returns on the S&P 500 on the x-axis and excess monthly returns on PM on the y-axis from 2014 to 2018. Estimate a linear trend line for the graph and include the equation of the trend line on the chart (Excels Trend Line function can do this for you). The trend line equation will tell you what the estimate for PMs equity beta is.
Hint: Calculate monthly excess returns by subtracting the monthly return on Treasuries from the stock return and the S&P 500 return, respectively.
Question 3 Estimate the Cost of Equity for the Project using the CAPM Using your results from Question 2, estimate the cost of equity for this project by applying the CAPM. Be careful to tell me which risk-free rate you chose when applying the CAPM formula
[] = + ([] ).
Question 4 Estimate the Cost of Debt for the Project Using the data provided in the Excel file on Blackboard, provide an estimate for the cost of debt for the project. Be careful to tell me which bond(s) you picked to calculate the cost of debt.
Question 5 Estimate the Unlevered Cost of Capital for the Project Assume that PM targets the same debt to enterprise value ratio for the project as it has on 12/31/2018. A) Calculate the debt to enterprise value ratio of PM on 12/31/2018. B) Calculate the unlevered cost of capital () for the project.
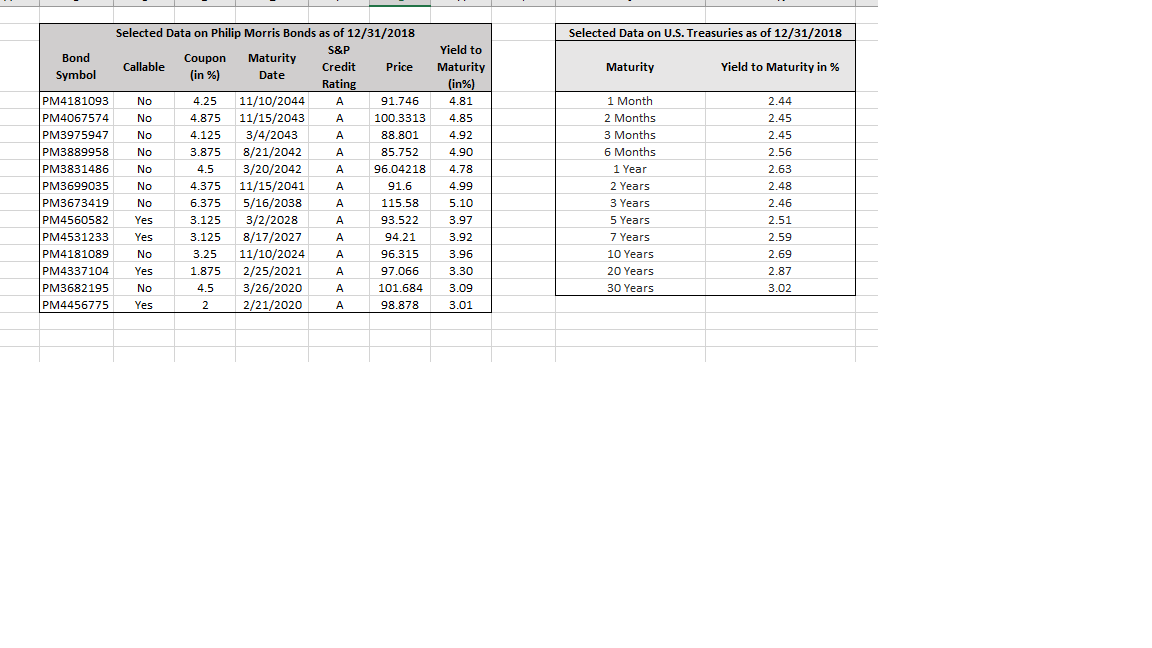
Selected Data on U.S. Treasuries as of 12/31/2018 Maturity Yield to Maturity in % Selected Data on Philip Morris Bonds as of 12/31/2018 S&P Bond Coupon Maturity Callable Symbol (in %) Date Credit Price Rating PM4181093 No 4.25 11/10/2044 91.746 PM4067574 No 4.875 11/15/2043 100.3313 PM3975947 No 4.125 3/4/2043 A 88.801 PM3889958 No 3.875 8/21/2042 85.752 PM3831486 No 4.5 3/20/2042 96.04218 PM3699035 No 4.375 11/15/2041 91.6 PM3673419 No 6.375 5/16/2038 115.58 PM4560582 Yes 3.125 3/2/2028 A 93.522 PM4531233 Yes 3.125 8/17/2027 A 94.21 PM4181089 3.25 11/10/2024 A 96.315 PM4337104 Yes 1.875 2/25/2021 A 97.066 PM3682195 4.5 3/26/2020 A 101.684 PM4456775 Yes 2 2 /21/2020 A 98.878 Yield to Maturity (in %) 4.81 4.85 4.92 4.90 4.78 4.99 5.10 3.97 3.92 3.96 3.30 3.09 3.01 1 Month 2 Months 3 Months 6 Months 1 Year 2 Years 3 Years 5 Years 7 Years 10 Years 20 Years 30 Years 2.44 2.45 2.45 2.56 2.63 2.48 2.46 2.51 2.59 2.69 2.87 3.02 No No Date Historical Financial Data for Philip Morris Cash and Short-Term Long-Term Common Short-Term Debt (in $ Debt (in $ Shares Investments millions) millions) Outstanding (in $ millions) (in millions) Share Price at End of Quarter 12/31/2018 9/30/2018 6/30/2018 3/31/2018 12/31/2017 9/30/2017 6/30/2017 3/31/2017 12/31/2016 9/30/2016 6/30/2016 3/31/2016 12/31/2015 9/30/2015 6/30/2015 3/31/2015 12/31/2014 9/30/2014 6/30/2014 3/31/2014 $6,620 $5,913 $6,622 $7,231 $8,447 $7,667 $6,197 $5,076 $4,239 $4,884 $3,814 $2,944 $3,417 $2,393 $1,838 $1,524 $1,682 $2,043 $1,541 $1,823 $4,784 $3,587 $3,617 $5,270 $3,005 $5,910 $5,152 $2,758 $3,216 $3,127 $1,871 $3,110 $3,230 $3,107 $4,636 $5,013 $2,526 $3,448 $2,348 $3,690 $26,975 $28,179 $28,048 $29.578 $31,334 $28,065 $26,595 $28,588 $25,851 $26,960 $28,098 $26,683 $25,250 $25,800 $24,566 $25,572 $26,929 $25,395 $27,161 $25,989 1554.58 1554.52 1554.494 1554.466 1553.218 1553.195 1553.187 1553.14 1551.386 1551.347 1551.324 1551.257 1549.344 1549.294 1549.176 1549.096 1546.9 1555.959 1564.761 1576.218 $66.76 $81.54 $80.74 $99.40 $105.65 $111.01 $117.45 $112.90 $91.49 $97.22 $101.72 $98.11 $87.91 $79.33 $80.17 $75.33 $81.45 $83.40 $84.31 $81.87 AB Date 12/31/2018 11/30/2018 10/31/2018 9/28/2018 8/31/2018 7/31/2018 6/29/2018 5/31/2018 4/30/2018 3/29/2018 2/28/2018 1/31/2018 12/29/2017 11/30/2017 10/31/2017 9/29/2017 8/31/2017 7/31/2017 6/30/2017 5/31/2017 4/28/2017 3/31/2017 2/28/2017 1/31/2017 12/30/2016 11/30/2016 10/31/2016 9/30/2016 8/31/2016 7/29/2016 6/30/2016 5/31/2016 4/29/2016 3/31/2016 2/29/2016 1/29/2016 12/31/2015 11/30/2015 10/30/2015 9/30/2015 8/31/2015 7/31/2015 6/30/2015 5/29/2015 4/30/2015 3/31/2015 2/27/2015 1/30/2015 12/31/2014 11/28/2014 10/31/2014 9/30/2014 8/29/2014 7/31/2014 6/30/2014 5/30/2014 4/30/2014 3/31/2014 2/28/2014 1/31/2014 Returns Data Monthly Monthly Monthl Return on Return on 3 Philip the S&P 500 Return Morris Index on -0.215301 -0.091777 0.001900 -0.017486 0.017859 0.001800 0.080083 -0.069403 0.001900 0.061497 0.004294 0.001500 -0.097451 0.030263 0.001600 0.068863 0.036022 0.001600 0.029419 0.004842 0.001400 -0.030000 0.021608 0.001400 -0.175050 0.002719 0.001400 -0.029744 -0.026885 0.001200 -0.034319 -0.038947 0.001100 0.014955 0.056179 0.001100 0.038637 0.009832 0.000900 -0.018062 0.028083 0.000800 -0.057382 0.022188 0.000900 -0.041478 0.019303 0.000900 0.001885 0.000546 0.000900 -0.006301 0.019349 0.000700 -0.010935 0.004814 0.000600 0.080837 0.011576 0.000600 -0.018246 0.009091 0.000500 0.041975 -0.000389 0.000300 0.137522 0.037198 0.000400 0.050716 0.017884 0.000400 0.048142 0.018201 0.000300 -0.084612 0.034174 0.000100 -0.008023 -0.019426 0.000200 -0.016712 -0.001234 0.000200 -0.003291 -0.001219 0.000200 -0.014353 0.035610 0.000200 0.041143 0.000906 0.000200 0.005707 0.015329 0.000100 0.000102 0.002699 0.000100 0.088982 0.065991 0.000200 0.011332 -0.004128 0.000200 0.023888 -0.050735 0.000100 0.017622 -0.017530 0.000100 -0.011425 0.000505 0.000000 0.114333 0.082983 0.000000 0.006892 -0.026443 0.000000 -0.066994 -0.062581 0.000000 0.066858 0.019742 0.000000 -0.022872 -0.021012 0.000000 -0.004792 0.010491 0.000000 0.108058 0.008521 0.000000 -0.079918 -0.017396 0.000000 0.033898 0.054893 0.000000 -0.014856 -0.031041 0.000000 -0.051536 -0.004189 0.000000 -0.023368 0.024534 0.000000 0.067266 0.023201 0.000000 -0.013788 -0.015514 0.000000 0.043531 0.037655 0.000000 -0.027280 -0.015080 0.000000 -0.037158 0.019058 0.000000 0.036404 0.021030 0.000000 0.043484 0.006201 0.000000 0.023483 0.006932 0.000000 0.035449 0.043117 0.000000 -0.103179 -0.035583 0.000000 Selected Data on U.S. Treasuries as of 12/31/2018 Maturity Yield to Maturity in % Selected Data on Philip Morris Bonds as of 12/31/2018 S&P Bond Coupon Maturity Callable Symbol (in %) Date Credit Price Rating PM4181093 No 4.25 11/10/2044 91.746 PM4067574 No 4.875 11/15/2043 100.3313 PM3975947 No 4.125 3/4/2043 A 88.801 PM3889958 No 3.875 8/21/2042 85.752 PM3831486 No 4.5 3/20/2042 96.04218 PM3699035 No 4.375 11/15/2041 91.6 PM3673419 No 6.375 5/16/2038 115.58 PM4560582 Yes 3.125 3/2/2028 A 93.522 PM4531233 Yes 3.125 8/17/2027 A 94.21 PM4181089 3.25 11/10/2024 A 96.315 PM4337104 Yes 1.875 2/25/2021 A 97.066 PM3682195 4.5 3/26/2020 A 101.684 PM4456775 Yes 2 2 /21/2020 A 98.878 Yield to Maturity (in %) 4.81 4.85 4.92 4.90 4.78 4.99 5.10 3.97 3.92 3.96 3.30 3.09 3.01 1 Month 2 Months 3 Months 6 Months 1 Year 2 Years 3 Years 5 Years 7 Years 10 Years 20 Years 30 Years 2.44 2.45 2.45 2.56 2.63 2.48 2.46 2.51 2.59 2.69 2.87 3.02 No No Date Historical Financial Data for Philip Morris Cash and Short-Term Long-Term Common Short-Term Debt (in $ Debt (in $ Shares Investments millions) millions) Outstanding (in $ millions) (in millions) Share Price at End of Quarter 12/31/2018 9/30/2018 6/30/2018 3/31/2018 12/31/2017 9/30/2017 6/30/2017 3/31/2017 12/31/2016 9/30/2016 6/30/2016 3/31/2016 12/31/2015 9/30/2015 6/30/2015 3/31/2015 12/31/2014 9/30/2014 6/30/2014 3/31/2014 $6,620 $5,913 $6,622 $7,231 $8,447 $7,667 $6,197 $5,076 $4,239 $4,884 $3,814 $2,944 $3,417 $2,393 $1,838 $1,524 $1,682 $2,043 $1,541 $1,823 $4,784 $3,587 $3,617 $5,270 $3,005 $5,910 $5,152 $2,758 $3,216 $3,127 $1,871 $3,110 $3,230 $3,107 $4,636 $5,013 $2,526 $3,448 $2,348 $3,690 $26,975 $28,179 $28,048 $29.578 $31,334 $28,065 $26,595 $28,588 $25,851 $26,960 $28,098 $26,683 $25,250 $25,800 $24,566 $25,572 $26,929 $25,395 $27,161 $25,989 1554.58 1554.52 1554.494 1554.466 1553.218 1553.195 1553.187 1553.14 1551.386 1551.347 1551.324 1551.257 1549.344 1549.294 1549.176 1549.096 1546.9 1555.959 1564.761 1576.218 $66.76 $81.54 $80.74 $99.40 $105.65 $111.01 $117.45 $112.90 $91.49 $97.22 $101.72 $98.11 $87.91 $79.33 $80.17 $75.33 $81.45 $83.40 $84.31 $81.87 AB Date 12/31/2018 11/30/2018 10/31/2018 9/28/2018 8/31/2018 7/31/2018 6/29/2018 5/31/2018 4/30/2018 3/29/2018 2/28/2018 1/31/2018 12/29/2017 11/30/2017 10/31/2017 9/29/2017 8/31/2017 7/31/2017 6/30/2017 5/31/2017 4/28/2017 3/31/2017 2/28/2017 1/31/2017 12/30/2016 11/30/2016 10/31/2016 9/30/2016 8/31/2016 7/29/2016 6/30/2016 5/31/2016 4/29/2016 3/31/2016 2/29/2016 1/29/2016 12/31/2015 11/30/2015 10/30/2015 9/30/2015 8/31/2015 7/31/2015 6/30/2015 5/29/2015 4/30/2015 3/31/2015 2/27/2015 1/30/2015 12/31/2014 11/28/2014 10/31/2014 9/30/2014 8/29/2014 7/31/2014 6/30/2014 5/30/2014 4/30/2014 3/31/2014 2/28/2014 1/31/2014 Returns Data Monthly Monthly Monthl Return on Return on 3 Philip the S&P 500 Return Morris Index on -0.215301 -0.091777 0.001900 -0.017486 0.017859 0.001800 0.080083 -0.069403 0.001900 0.061497 0.004294 0.001500 -0.097451 0.030263 0.001600 0.068863 0.036022 0.001600 0.029419 0.004842 0.001400 -0.030000 0.021608 0.001400 -0.175050 0.002719 0.001400 -0.029744 -0.026885 0.001200 -0.034319 -0.038947 0.001100 0.014955 0.056179 0.001100 0.038637 0.009832 0.000900 -0.018062 0.028083 0.000800 -0.057382 0.022188 0.000900 -0.041478 0.019303 0.000900 0.001885 0.000546 0.000900 -0.006301 0.019349 0.000700 -0.010935 0.004814 0.000600 0.080837 0.011576 0.000600 -0.018246 0.009091 0.000500 0.041975 -0.000389 0.000300 0.137522 0.037198 0.000400 0.050716 0.017884 0.000400 0.048142 0.018201 0.000300 -0.084612 0.034174 0.000100 -0.008023 -0.019426 0.000200 -0.016712 -0.001234 0.000200 -0.003291 -0.001219 0.000200 -0.014353 0.035610 0.000200 0.041143 0.000906 0.000200 0.005707 0.015329 0.000100 0.000102 0.002699 0.000100 0.088982 0.065991 0.000200 0.011332 -0.004128 0.000200 0.023888 -0.050735 0.000100 0.017622 -0.017530 0.000100 -0.011425 0.000505 0.000000 0.114333 0.082983 0.000000 0.006892 -0.026443 0.000000 -0.066994 -0.062581 0.000000 0.066858 0.019742 0.000000 -0.022872 -0.021012 0.000000 -0.004792 0.010491 0.000000 0.108058 0.008521 0.000000 -0.079918 -0.017396 0.000000 0.033898 0.054893 0.000000 -0.014856 -0.031041 0.000000 -0.051536 -0.004189 0.000000 -0.023368 0.024534 0.000000 0.067266 0.023201 0.000000 -0.013788 -0.015514 0.000000 0.043531 0.037655 0.000000 -0.027280 -0.015080 0.000000 -0.037158 0.019058 0.000000 0.036404 0.021030 0.000000 0.043484 0.006201 0.000000 0.023483 0.006932 0.000000 0.035449 0.043117 0.000000 -0.103179 -0.035583 0.000000
Step by Step Solution
There are 3 Steps involved in it
Step: 1

Get Instant Access to Expert-Tailored Solutions
See step-by-step solutions with expert insights and AI powered tools for academic success
Step: 2

Step: 3
Ace Your Homework with AI
Get the answers you need in no time with our AI-driven, step-by-step assistance
Get Started
Understanding Financial Risk Management
Authors: Angelo Corelli
1st Edition
0415746183, 978-0415746182