Answered step by step
Verified Expert Solution
Question
1 Approved Answer
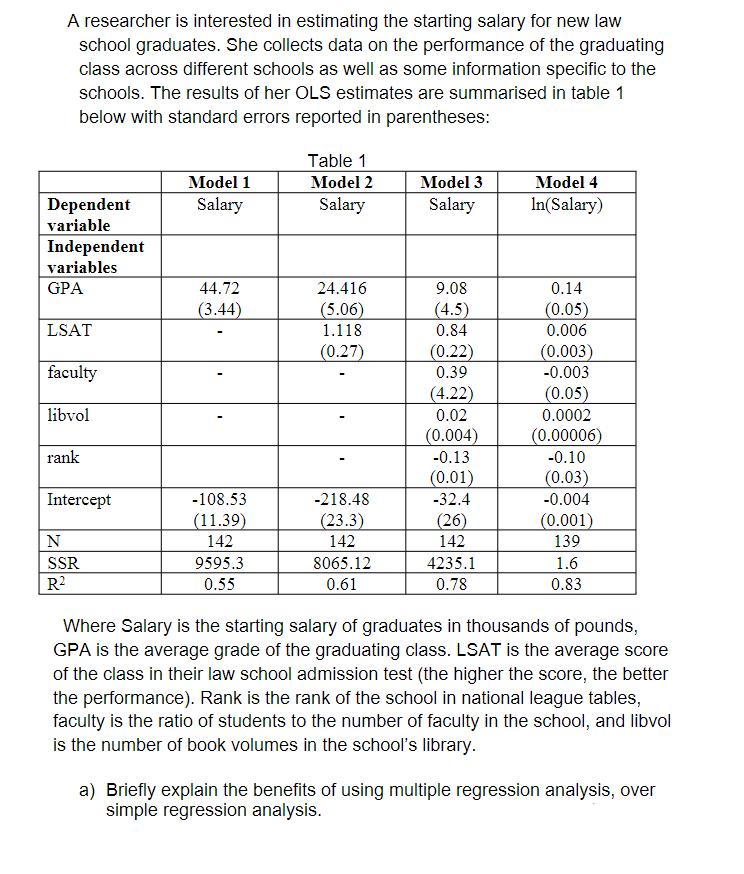
A researcher is interested in estimating the starting salary for new law school graduates. She collects data on the performance of the graduating class


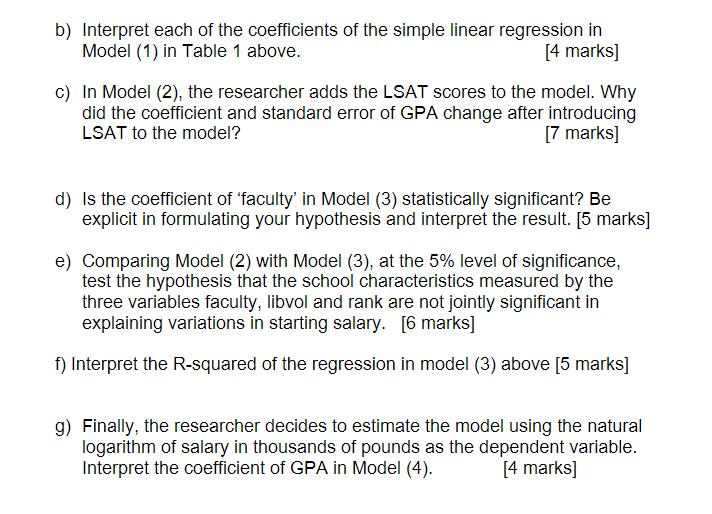
A researcher is interested in estimating the starting salary for new law school graduates. She collects data on the performance of the graduating class across different schools as well as some information specific to the schools. The results of her OLS estimates are summarised in table 1 below with standard errors reported in parentheses: Dependent variable Independent variables GPA LSAT faculty libvol rank Intercept N SSR R Model 1 Salary 44.72 (3.44) -108.53 (11.39) 142 9595.3 0.55 Table 1 Model 2 Salary 24.416 (5.06) 1.118 (0.27) -218.48 (23.3) 142 8065.12 0.61 Model 3 Salary 9.08 (4.5) 0.84 (0.22) 0.39 (4.22) 0.02 (0.004) -0.13 (0.01) -32.4 (26) 142 4235.1 0.78 Model 4 In(Salary) 0.14 (0.05) 0.006 (0.003) -0.003 (0.05) 0.0002 (0.00006) -0.10 (0.03) -0.004 (0.001) 139 1.6 0.83 Where Salary is the starting salary of graduates in thousands of pounds, GPA is the average grade of the graduating class. LSAT is the average score of the class in their law school admission test (the higher the score, the better the performance). Rank is the rank of the school in national league tables, faculty is the ratio of students to the number of faculty in the school, and libvol is the number of book volumes in the school's library. a) Briefly explain the benefits of using multiple regression analysis, over simple regression analysis. b) Interpret each of the coefficients of the simple linear regression in Model (1) in Table 1 above. [4 marks] c) In Model (2), the researcher adds the LSAT scores to the model. Why did the coefficient and standard error of GPA change after introducing LSAT to the model? [7 marks] d) Is the coefficient of 'faculty' in Model (3) statistically significant? Be explicit in formulating your hypothesis and interpret the result. [5 marks] e) Comparing Model (2) with Model (3), at the 5% level of significance, test the hypothesis that the school characteristics measured by the three variables faculty, libvol and rank are not jointly significant in explaining variations in starting salary. [6 marks] f) Interpret the R-squared of the regression in model (3) above [5 marks] g) Finally, the researcher decides to estimate the model using the natural logarithm of salary in thousands of pounds as the dependent variable. Interpret the coefficient of GPA in Model (4). [4 marks]
Step by Step Solution
★★★★★
3.31 Rating (151 Votes )
There are 3 Steps involved in it
Step: 1
9 multiple Linear allows us to assess the strugth of the regression relationship between a response ...
Get Instant Access to Expert-Tailored Solutions
See step-by-step solutions with expert insights and AI powered tools for academic success
Step: 2

Step: 3

Document Format ( 2 attachments)
635da62b1e069_177658.pdf
180 KBs PDF File
635da62b1e069_177658.docx
120 KBs Word File
Ace Your Homework with AI
Get the answers you need in no time with our AI-driven, step-by-step assistance
Get Started


