Question
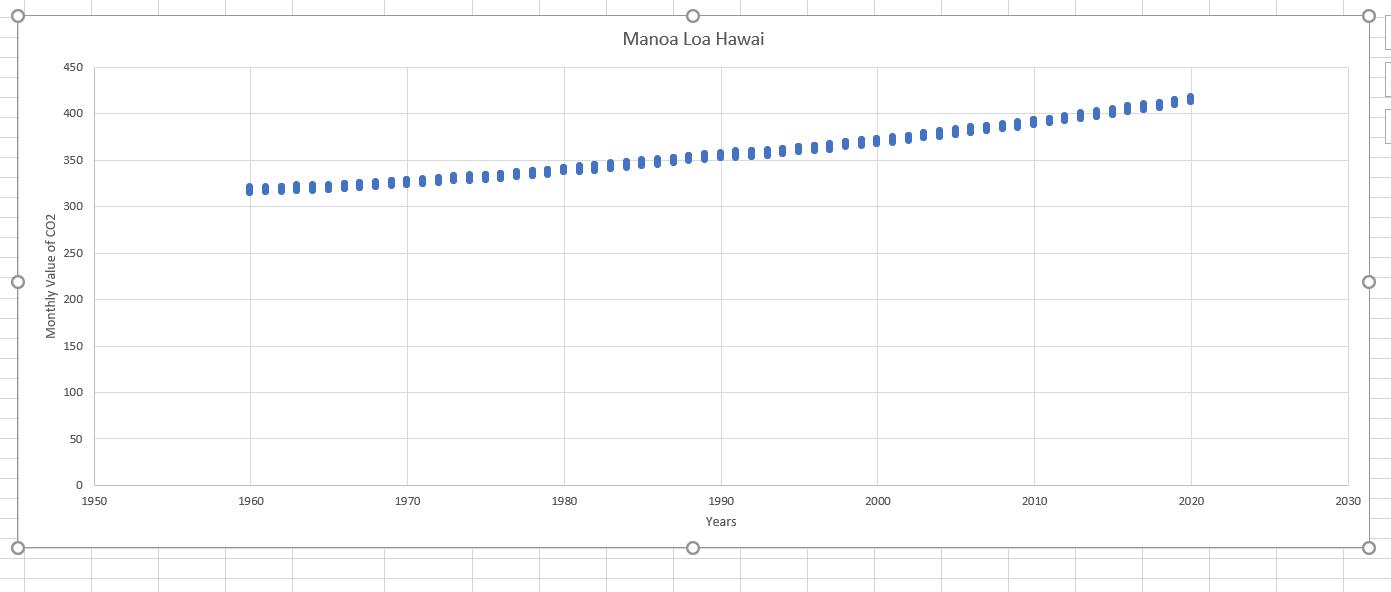
Manoa Loa Hawai 350 100 50 1990 Years Monthly Value of CO2 3) Now, calculate the annual average for each year (you should get


Manoa Loa Hawai 350 100 50 1990 Years Monthly Value of CO2 3) Now, calculate the annual average for each year (you should get 61 values). Make a graphic of those 61 values (annual averages). Can you comment on their trend? Do you see cycles? Calculate their standard deviation. Which standard deviation is larger, the first one associated to the 734 values, or the second one associated to the 61 values? 4) Now, calculate the average values for all the Januaries (hyper January value), all the Februaries (hyper February value), all the Marchs (hyper March value) and so on for all the months of a hyper year. Make them a graphic of how for a hyper year the average monthly value evolves.
Step by Step Solution
3.44 Rating (163 Votes )
There are 3 Steps involved in it
Step: 1
Now calculate the annual average for each year you should get 61 values Make a graphic of those 61 v...
Get Instant Access to Expert-Tailored Solutions
See step-by-step solutions with expert insights and AI powered tools for academic success
Step: 2

Step: 3

Ace Your Homework with AI
Get the answers you need in no time with our AI-driven, step-by-step assistance
Get StartedRecommended Textbook for
Thermodynamics An Interactive Approach
Authors: Subrata Bhattacharjee
1st edition
130351172, 978-0130351173
Students also viewed these Banking questions
Question
Answered: 1 week ago
Question
Answered: 1 week ago
Question
Answered: 1 week ago
Question
Answered: 1 week ago
Question
Answered: 1 week ago
Question
Answered: 1 week ago
Question
Answered: 1 week ago
Question
Answered: 1 week ago
Question
Answered: 1 week ago
Question
Answered: 1 week ago
Question
Answered: 1 week ago
Question
Answered: 1 week ago
Question
Answered: 1 week ago
Question
Answered: 1 week ago
Question
Answered: 1 week ago
Question
Answered: 1 week ago
Question
Answered: 1 week ago
Question
Answered: 1 week ago
Question
Answered: 1 week ago
Question
Answered: 1 week ago
Question
Answered: 1 week ago
Question
Answered: 1 week ago
Question
Answered: 1 week ago
Question
Answered: 1 week ago
View Answer in SolutionInn App


