Answered step by step
Verified Expert Solution
Question
1 Approved Answer
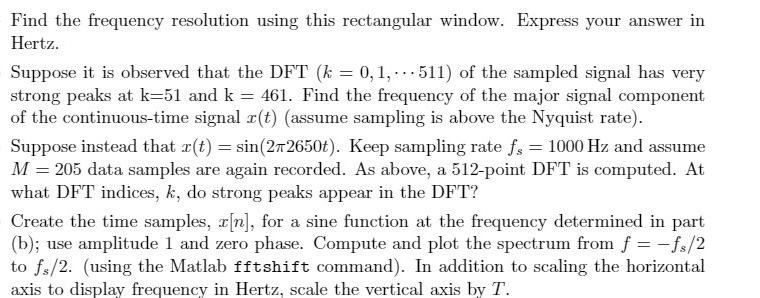
Find the frequency resolution using this rectangular window. Express your answer in Hertz. Suppose it is observed that the DFT (k = 0,1,511) of

Find the frequency resolution using this rectangular window. Express your answer in Hertz. Suppose it is observed that the DFT (k = 0,1,511) of the sampled signal has very strong peaks at k=51 and k = 461. Find the frequency of the major signal component of the continuous-time signal r(t) (assume sampling is above the Nyquist rate). Suppose instead that r(t) = sin(272650t). Keep sampling rate fs = 1000 Hz and assume M = 205 data samples are again recorded. As above, a 512-point DFT is computed. At what DFT indices, k, do strong peaks appear in the DFT? Create the time samples, r[n], for a sine function at the frequency determined in part (b); use amplitude 1 and zero phase. Compute and plot the spectrum from f = -fs/2 to f/2. (using the Matlab fftshift command). In addition to scaling the horizontal axis to display frequency in Hertz, scale the vertical axis by T.
Step by Step Solution
★★★★★
3.37 Rating (150 Votes )
There are 3 Steps involved in it
Step: 1
Answer Solution samping in at 1 kH The signal of 6s ...
Get Instant Access to Expert-Tailored Solutions
See step-by-step solutions with expert insights and AI powered tools for academic success
Step: 2

Step: 3

Ace Your Homework with AI
Get the answers you need in no time with our AI-driven, step-by-step assistance
Get Started


