Question
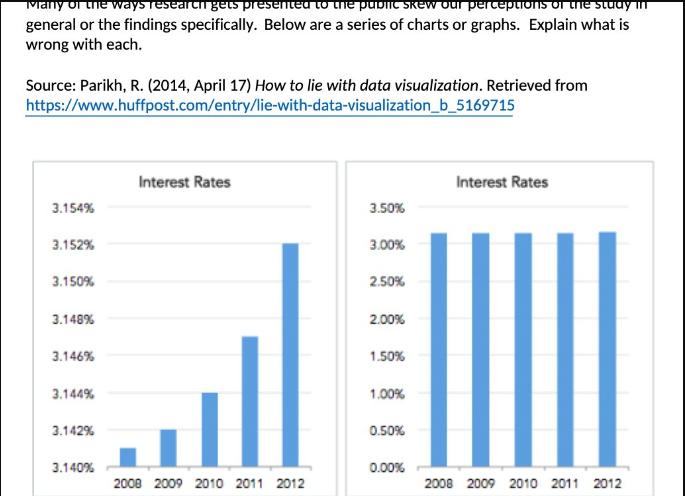
Many of the ways research gets presented to the public skew our perceptions of the study in general or the findings specifically. Below are

Many of the ways research gets presented to the public skew our perceptions of the study in general or the findings specifically. Below are a series of charts or graphs. Explain what is wrong with each. Source: Parikh, R. (2014, April 17) How to lie with data visualization. Retrieved from https://www.huffpost.com/entry/lie-with-data-visualization_b_5169715 3.154% 3.152% 3.150% 3.148% 3.146% 3.144% 3.142% 3.140% Interest Rates HE 2008 2009 2010 2011 2012 3.50% 3.00% 2.50% 2.00% 1.50% 1.00% 0.50% 0.00% Interest Rates 2008 2009 2010 2011 2012
Step by Step Solution
There are 3 Steps involved in it
Step: 1
1 Inconsistent YAxis Scaling The first issue is that it appears the Yaxis scaling is inconsistent be...
Get Instant Access to Expert-Tailored Solutions
See step-by-step solutions with expert insights and AI powered tools for academic success
Step: 2

Step: 3

Ace Your Homework with AI
Get the answers you need in no time with our AI-driven, step-by-step assistance
Get StartedRecommended Textbook for
Marketing Research
Authors: V. Kumar, Robert P. Leone, David A. Aaker, George S. Day
13th Edition
1119497639, 978-1119497639
Students also viewed these Business Communication questions
Question
Answered: 1 week ago
Question
Answered: 1 week ago
Question
Answered: 1 week ago
Question
Answered: 1 week ago
Question
Answered: 1 week ago
Question
Answered: 1 week ago
Question
Answered: 1 week ago
Question
Answered: 1 week ago
Question
Answered: 1 week ago
Question
Answered: 1 week ago
Question
Answered: 1 week ago
Question
Answered: 1 week ago
Question
Answered: 1 week ago
Question
Answered: 1 week ago
Question
Answered: 1 week ago
Question
Answered: 1 week ago
Question
Answered: 1 week ago
Question
Answered: 1 week ago
Question
Answered: 1 week ago
Question
Answered: 1 week ago
View Answer in SolutionInn App


