Question
Many random number generators allow users to specify the range of the random numbers to be produced. Suppose that you specify that the outcomes

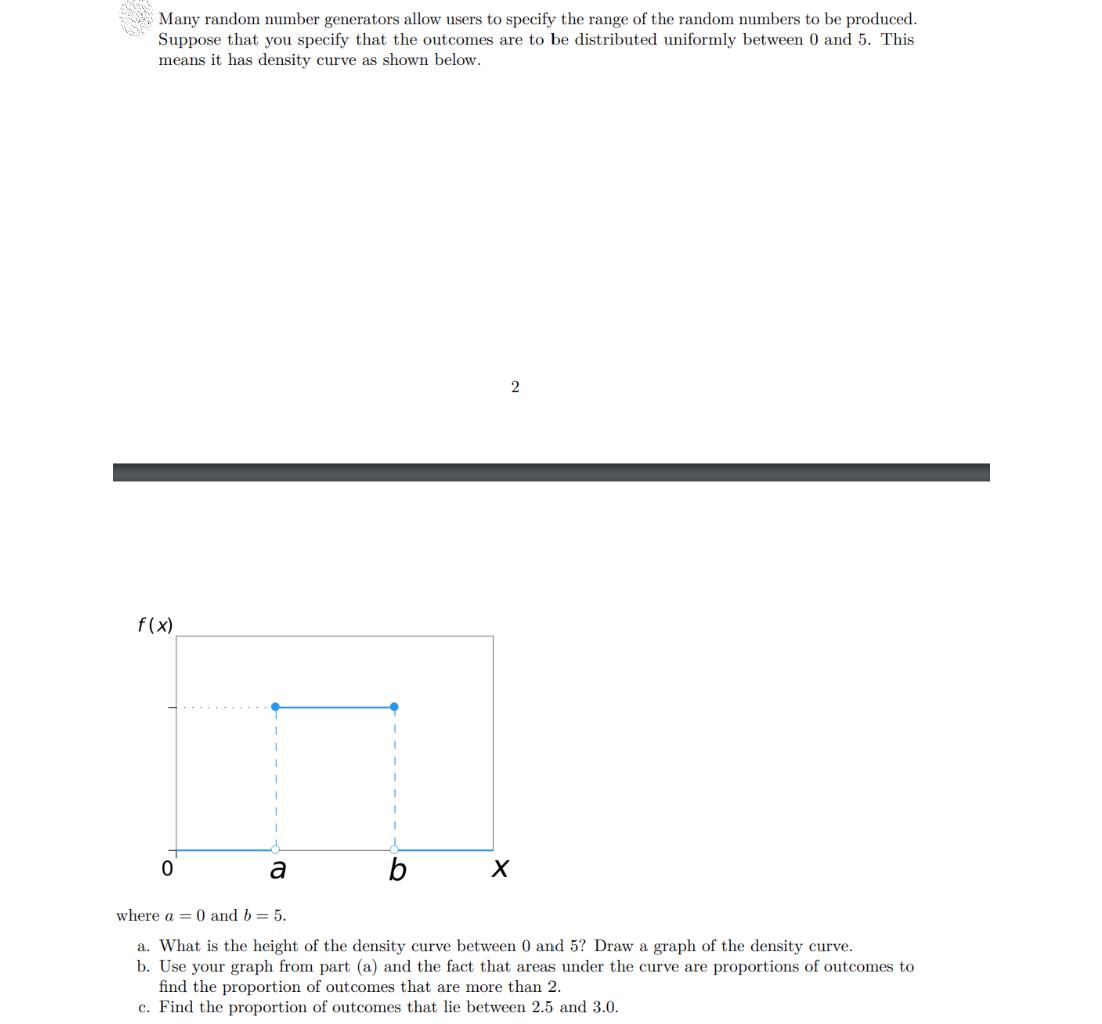
Many random number generators allow users to specify the range of the random numbers to be produced. Suppose that you specify that the outcomes are to be distributed uniformly between 0 and 5. This means it has density curve as shown below. f(x) 0 a b 2 X where a = 0 and b = 5. a. What is the height of the density curve between 0 and 5? Draw a graph of the density curve. b. Use your graph from part (a) and the fact that areas under the curve are proportions of outcomes to find the proportion of outcomes that are more than 2. c. Find the proportion of outcomes that lie between 2.5 and 3.0.
Step by Step Solution
3.40 Rating (150 Votes )
There are 3 Steps involved in it
Step: 1

Get Instant Access to Expert-Tailored Solutions
See step-by-step solutions with expert insights and AI powered tools for academic success
Step: 2

Step: 3

Ace Your Homework with AI
Get the answers you need in no time with our AI-driven, step-by-step assistance
Get StartedRecommended Textbook for
Mathematical Statistics With Applications In R
Authors: Chris P. Tsokos, K.M. Ramachandran
2nd Edition
124171133, 978-0124171138
Students also viewed these Mathematics questions
Question
Answered: 1 week ago
Question
Answered: 1 week ago
Question
Answered: 1 week ago
Question
Answered: 1 week ago
Question
Answered: 1 week ago
Question
Answered: 1 week ago
Question
Answered: 1 week ago
Question
Answered: 1 week ago
Question
Answered: 1 week ago
Question
Answered: 1 week ago
Question
Answered: 1 week ago
Question
Answered: 1 week ago
Question
Answered: 1 week ago
Question
Answered: 1 week ago
Question
Answered: 1 week ago
Question
Answered: 1 week ago
Question
Answered: 1 week ago
Question
Answered: 1 week ago
Question
Answered: 1 week ago
Question
Answered: 1 week ago
Question
Answered: 1 week ago
Question
Answered: 1 week ago
Question
Answered: 1 week ago
View Answer in SolutionInn App


