

Answered step by step
Verified Expert Solution
Question
1 Approved Answer
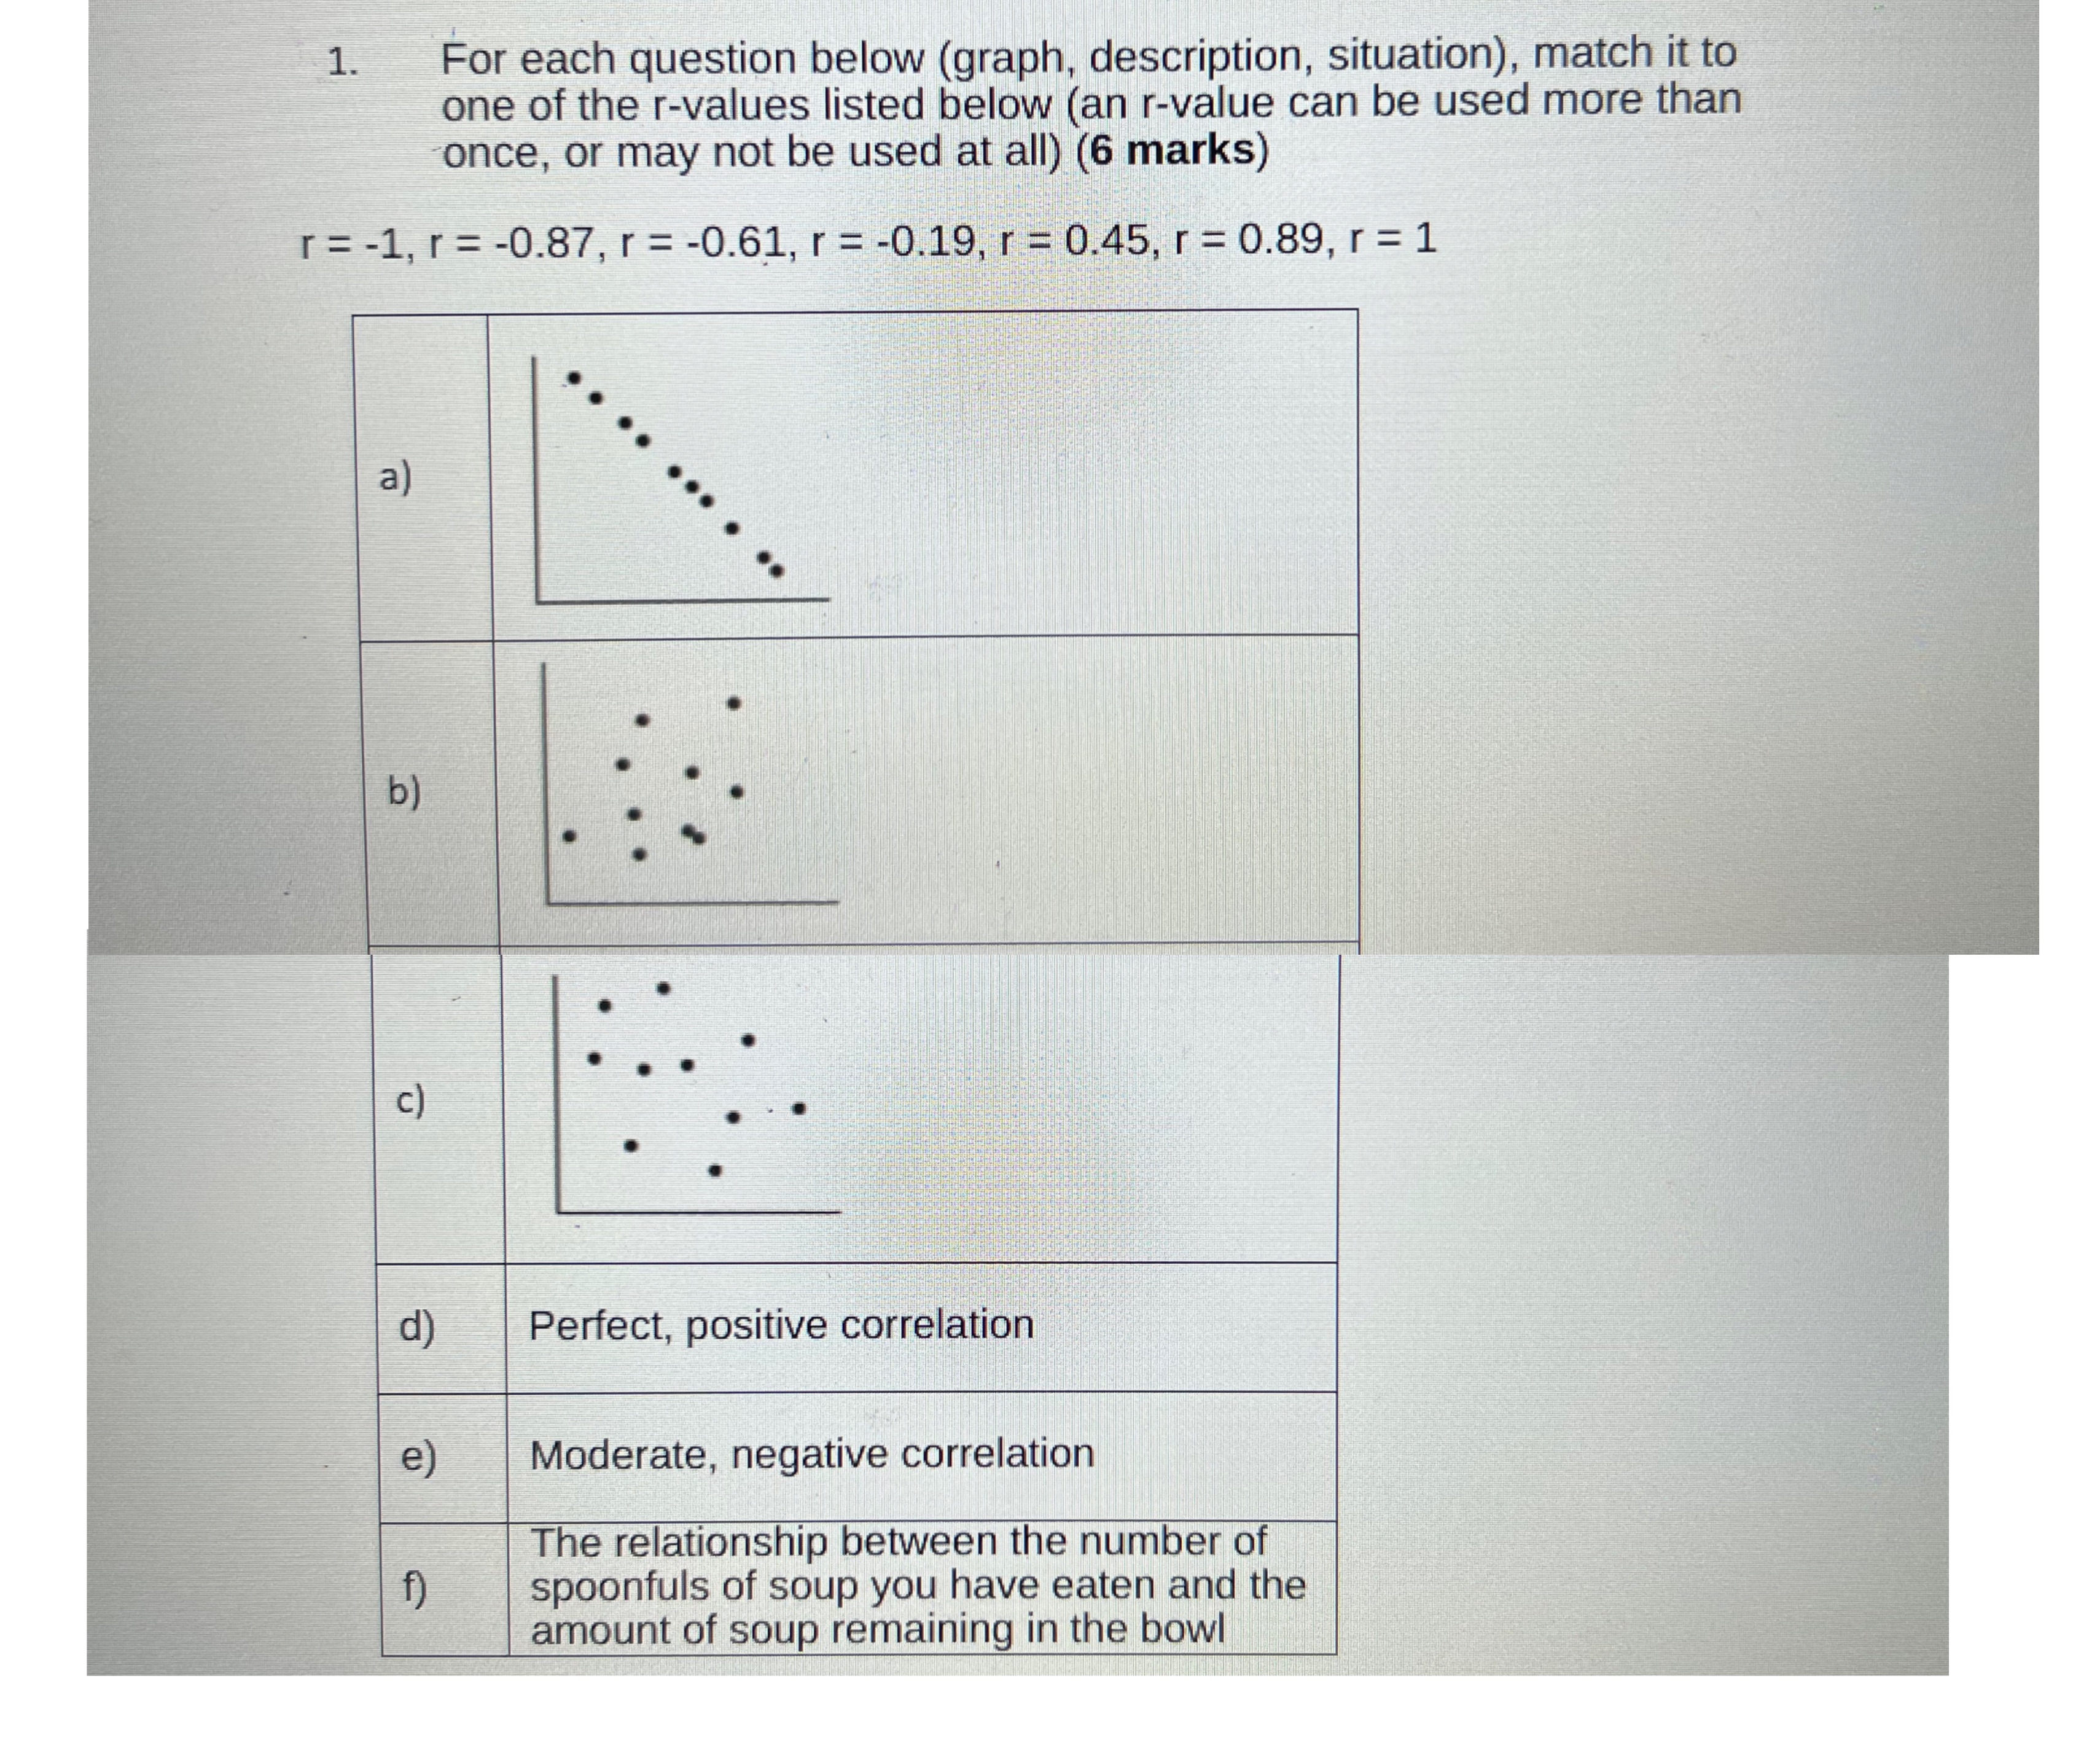
MAP4C(Grade12:Math) UNIT 4 DATA MANAGEMENT 1. For each question below (graph, description, situation), match it to one of the r-values listed below (an r-value can
MAP4C(Grade12:Math) UNIT 4 DATA MANAGEMENT
Step by Step Solution
There are 3 Steps involved in it
Step: 1

Get Instant Access to Expert-Tailored Solutions
See step-by-step solutions with expert insights and AI powered tools for academic success
Step: 2

Step: 3
Ace Your Homework with AI
Get the answers you need in no time with our AI-driven, step-by-step assistance
Get Started
Business Analytics Data Analysis and Decision Making
Authors: S. Christian Albright, Wayne L. Winston
5th edition
1133629601, 9781285965529 , 978-1133629603