Question
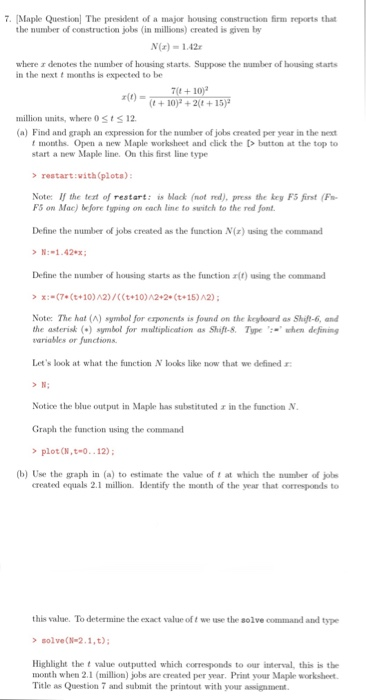
[Maple Question] The president of a major housing construction firm reports that the number of construction jobs (in millions) created is given by N(x) =

[Maple Question] The president of a major housing construction firm reports that the number of construction jobs (in millions) created is given by
N(x) = 1.42x where x denotes the number of housing starts. Suppose the number of housing starts
in the next t months is expected to be 
million units, where 0 t 12.
(a) Find and graph an expression for the number of jobs created per year in the nextt months. Open a new Maple worksheet and click the [> button at the top to start a new Maple line. On this first line type
> restart:with(plots):
Note: If the text of restart: is black (not red), press the key F5 first (Fn- F5 on Mac) before typing on each line to switch to the red font.
Define the number of jobs created as the function N(x) using the command> N:=1.42*x;
Define the number of housing starts as the function x(t) using the command
> x:=(7*(t+10)2)/((t+10)2+2*(t+15)2);
Note: The hat () symbol for exponents is found on the keyboard as Shift-6, and the asterisk () symbol for multiplication as Shift-8. Type := when defining variables or functions.
Lets look at what the function N looks like now that we defined x:> N; Notice the blue output in Maple has substituted x in the function N.
Graph the function using the command
> plot(N,t=0..12);
(b) Use the graph in (a) to estimate the value of t at which the number of jobs created equals 2.1 million. Identify the month of the year that corresponds to this value. To determine the exact value of t we use the solve command and type> solve(N=2.1,t);
Highlight the t value outputted which corresponds to our interval, this is the month when 2.1 (million) jobs are created per year. Title as Question 7 and submit the printout with your assignment.
7. Maple Questionl The president of a major housing construction firm reports that the number of construction jobs (in millions) created is given by N(z) = 1.42x where a demotes the number of housing starts. Suppose the number of housing starts in the nextt months is expected to be nt+10" +10)+2(t15 r(t) = million units, where 0Sts 12. (a) Find and graph an expression for the number of jobs created per year in the next f months. Open a new Maple worksheet and click the [> button at the top to start a new Maple line. On this first line type > restart:with(plota) Note: If the teat of restart: is Mack (not red), press the key F5 first (F F5 on Mac) before typing on each line to suitch to the red font. Define the number of jobs created as the function N(z) using the command N:-1.42*x Define the number of housing starts as the function a(f) using the command Note: The hat (A) symbol for erponents is found on the keyhoard as Shift-6, and the asterisk()symbol for multiplication as Shift-8. Typeh defining variales or functions Let's look at what the function N looks like now that we defined Notice the blue output in Maple has substituted r in the function N Graph the function using the command > plot (N,t 0..12) (b) Use the graph in (a) to estimate the value of t at which the number of jobs created equals 2.1 million Identify the month of the year that corresponds to this value. To determine the exact value of t we use the solve command and type >solve(N-2.1,t) Highlight the t value outputted which corresponds to our interval, this is the month when 2.1 (million) jobs are created per year. Print your Maple worksheet Title as Question 7 and submit the printout with your assignment. 7(t10) r(t)Step by Step Solution
There are 3 Steps involved in it
Step: 1

Get Instant Access to Expert-Tailored Solutions
See step-by-step solutions with expert insights and AI powered tools for academic success
Step: 2

Step: 3

Ace Your Homework with AI
Get the answers you need in no time with our AI-driven, step-by-step assistance
Get Started


