

Answered step by step
Verified Expert Solution
Question
1 Approved Answer
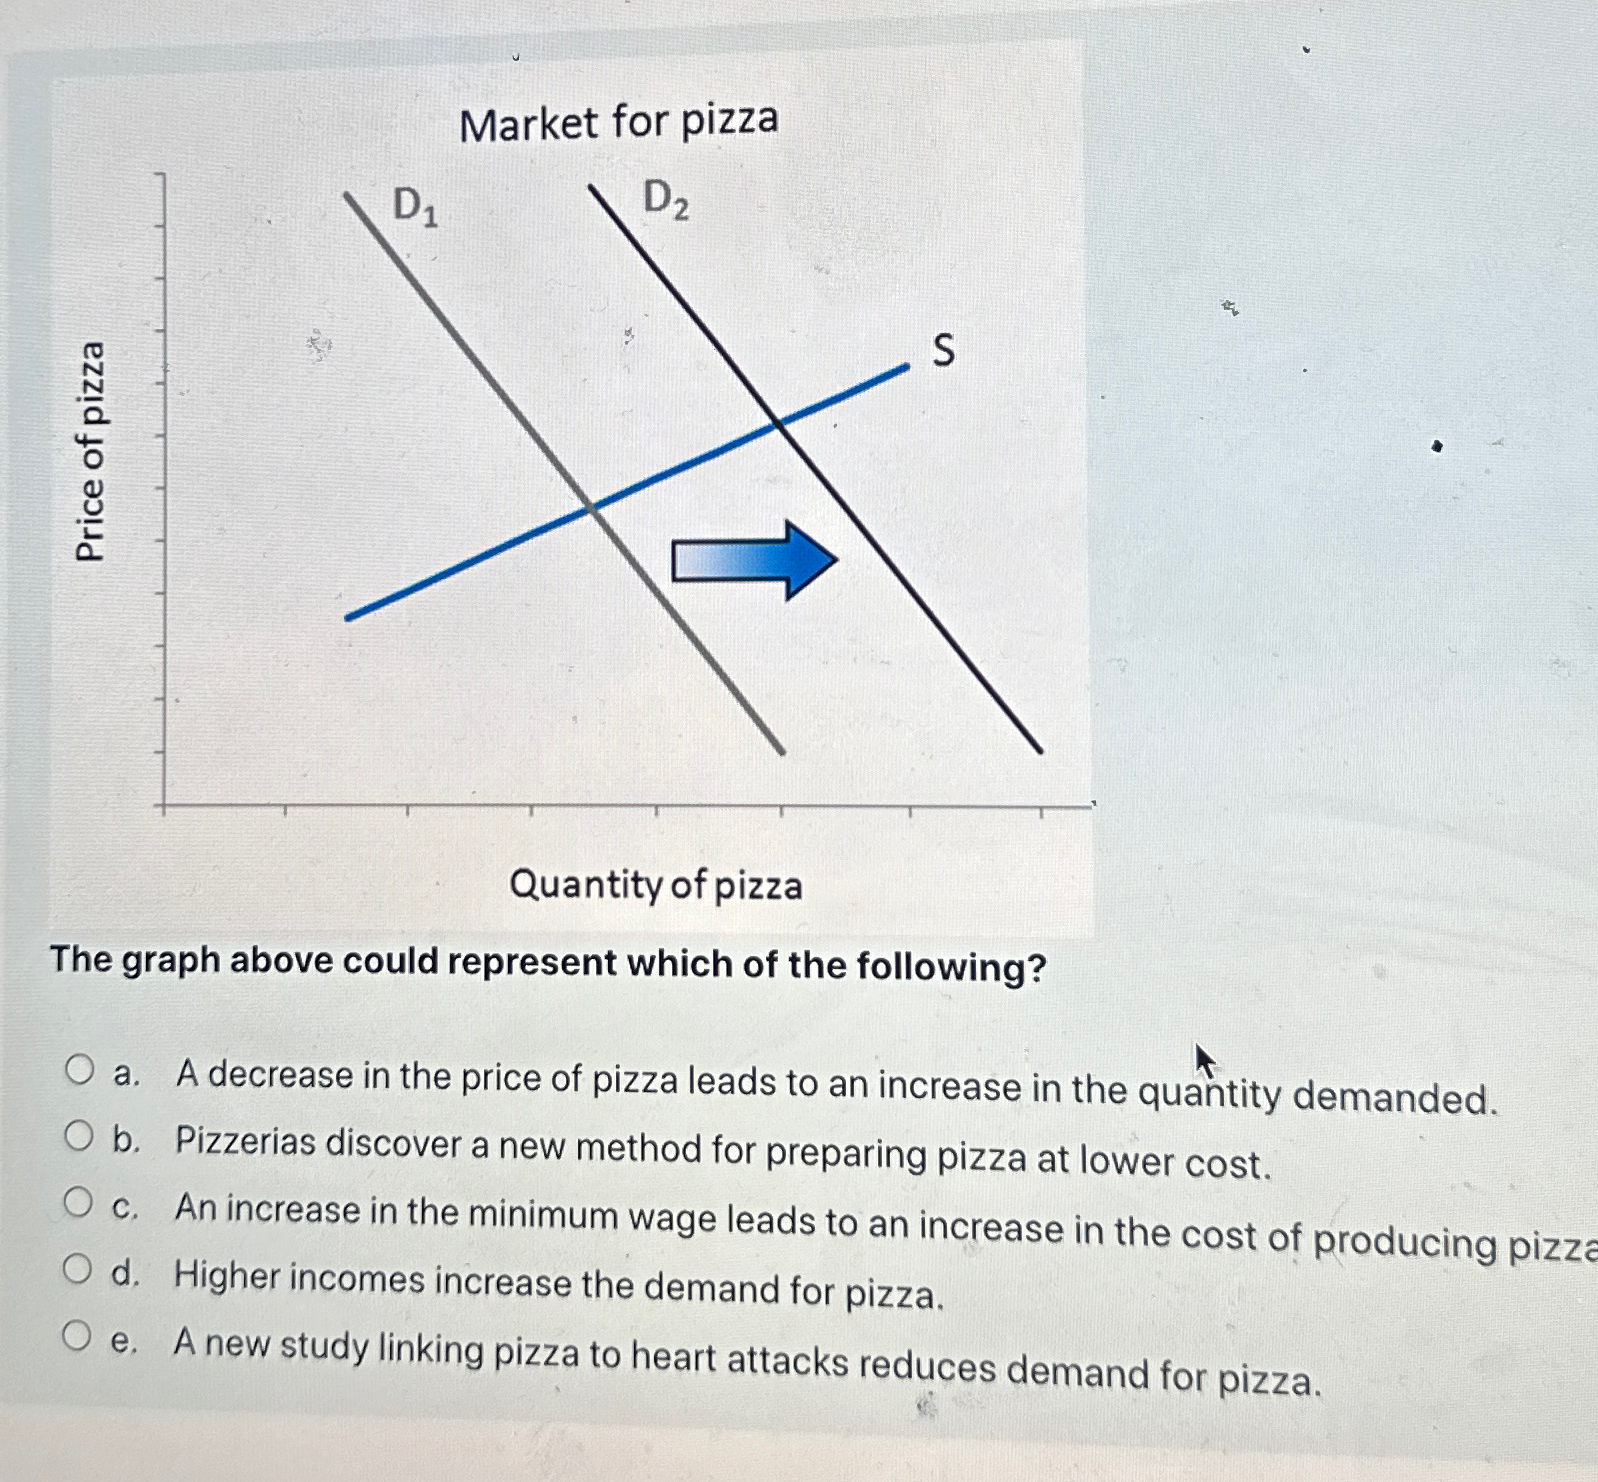
Market for pizza Quantity of pizza The graph above could represent which of the following? a . A decrease in the price of pizza leads
Market for pizza
Quantity of pizza
The graph above could represent which of the following?
a A decrease in the price of pizza leads to an increase in the quantity demanded.
b Pizzerias discover a new method for preparing pizza at lower cost.
c An increase in the minimum wage leads to an increase in the cost of producing pizza
d Higher incomes increase the demand for pizza.
e A new study linking pizza to heart attacks reduces demand for pizza.
Step by Step Solution
There are 3 Steps involved in it
Step: 1

Get Instant Access to Expert-Tailored Solutions
See step-by-step solutions with expert insights and AI powered tools for academic success
Step: 2

Step: 3
Ace Your Homework with AI
Get the answers you need in no time with our AI-driven, step-by-step assistance
Get Started
Ethics In Finance Case Studies From A Womans Life On Wall Street
Authors: Kara Tan Bhala
1st Edition
3030737535, 978-3030737535