

Answered step by step
Verified Expert Solution
Question
1 Approved Answer
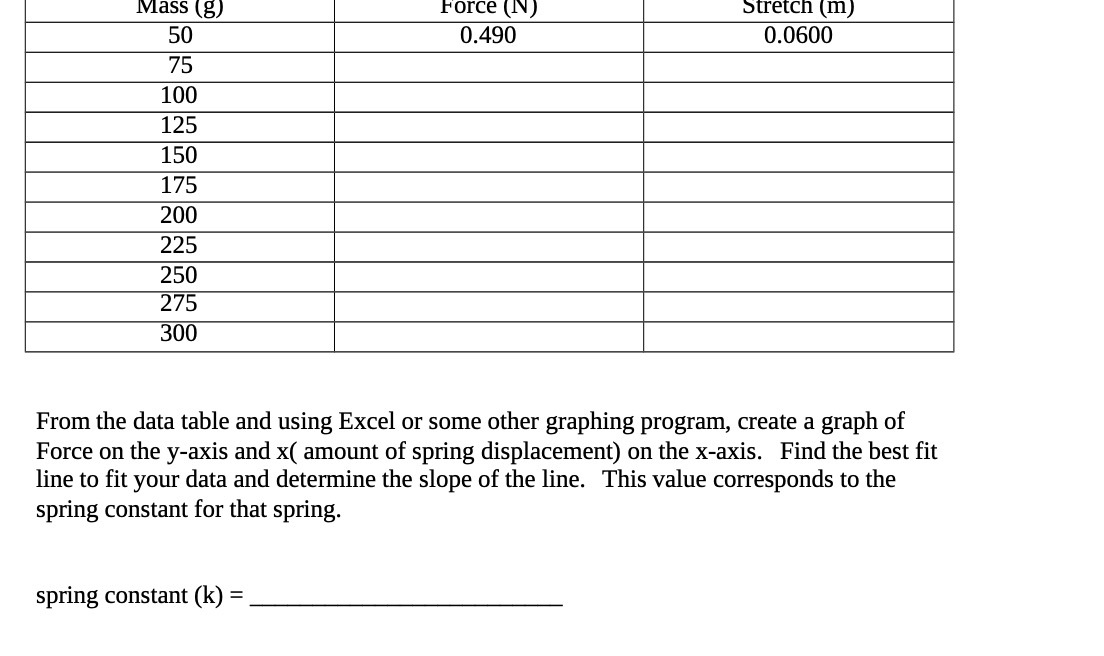
Mass (g) Force (N ) Stretch (m) 50 0.490 0.0600 75 100 125 150 175 200 225 250 275 300 From the data table and

Step by Step Solution
There are 3 Steps involved in it
Step: 1

Get Instant Access to Expert-Tailored Solutions
See step-by-step solutions with expert insights and AI powered tools for academic success
Step: 2

Step: 3
Ace Your Homework with AI
Get the answers you need in no time with our AI-driven, step-by-step assistance
Get Started
The Physics of Energy
Authors: Robert L. Jaffe, Washington Taylor
1st edition
1107016657, 978-1107016651