Answered step by step
Verified Expert Solution
Question
1 Approved Answer
Mastery Problem: CVP and the Contribution Margin Income Statement For planning and control purposes, managers have a powerful tool known as cost-volume-profit (CVP) analysis.
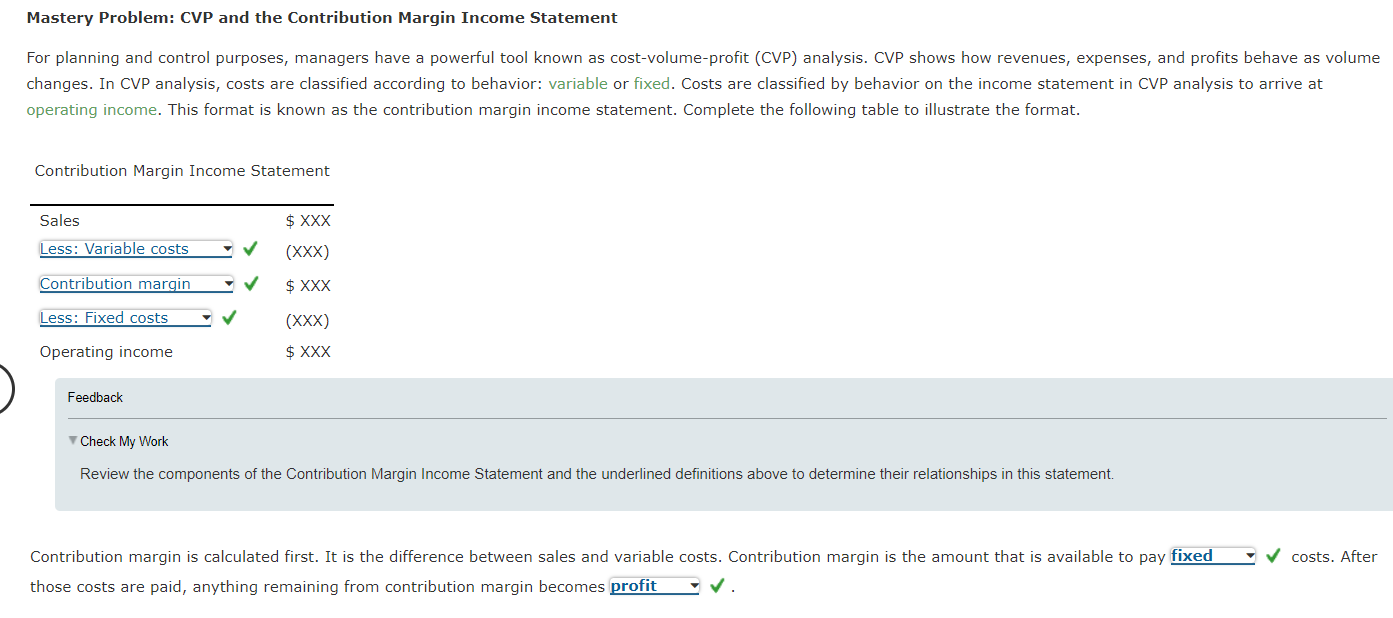
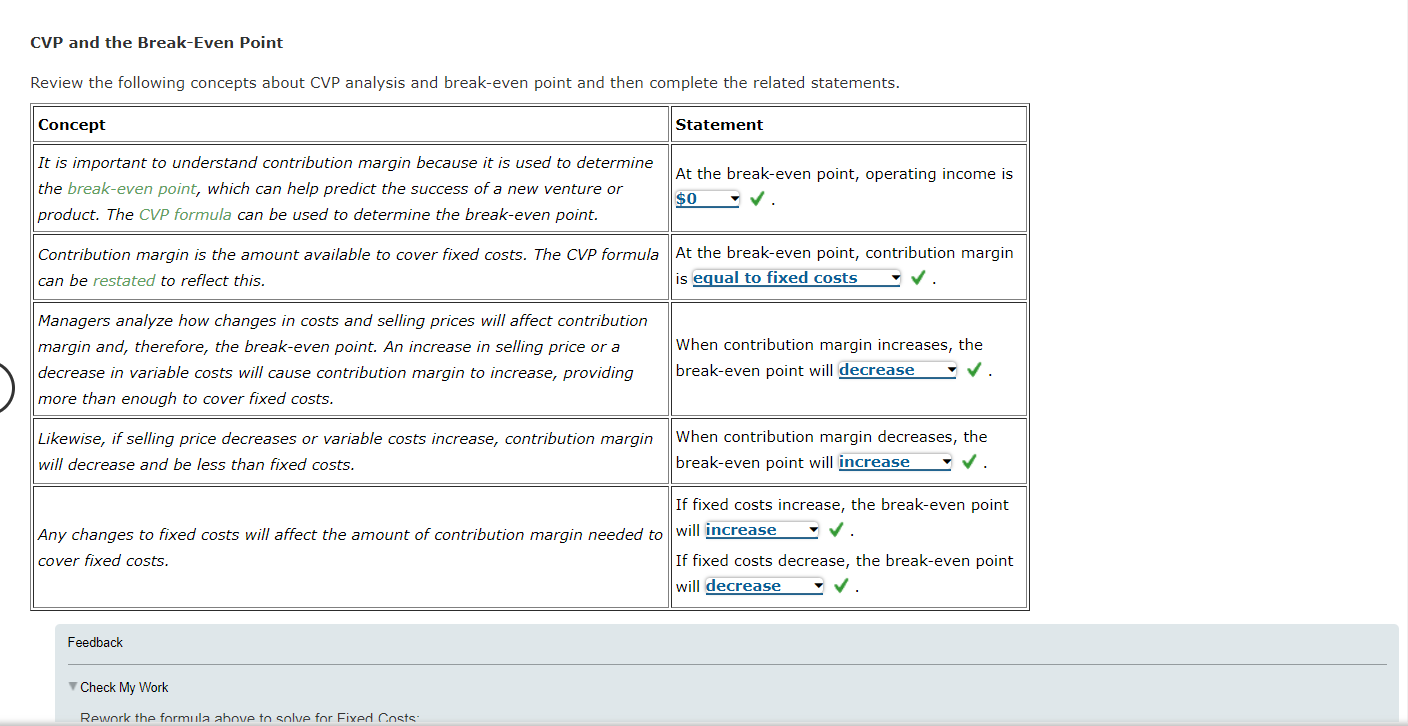
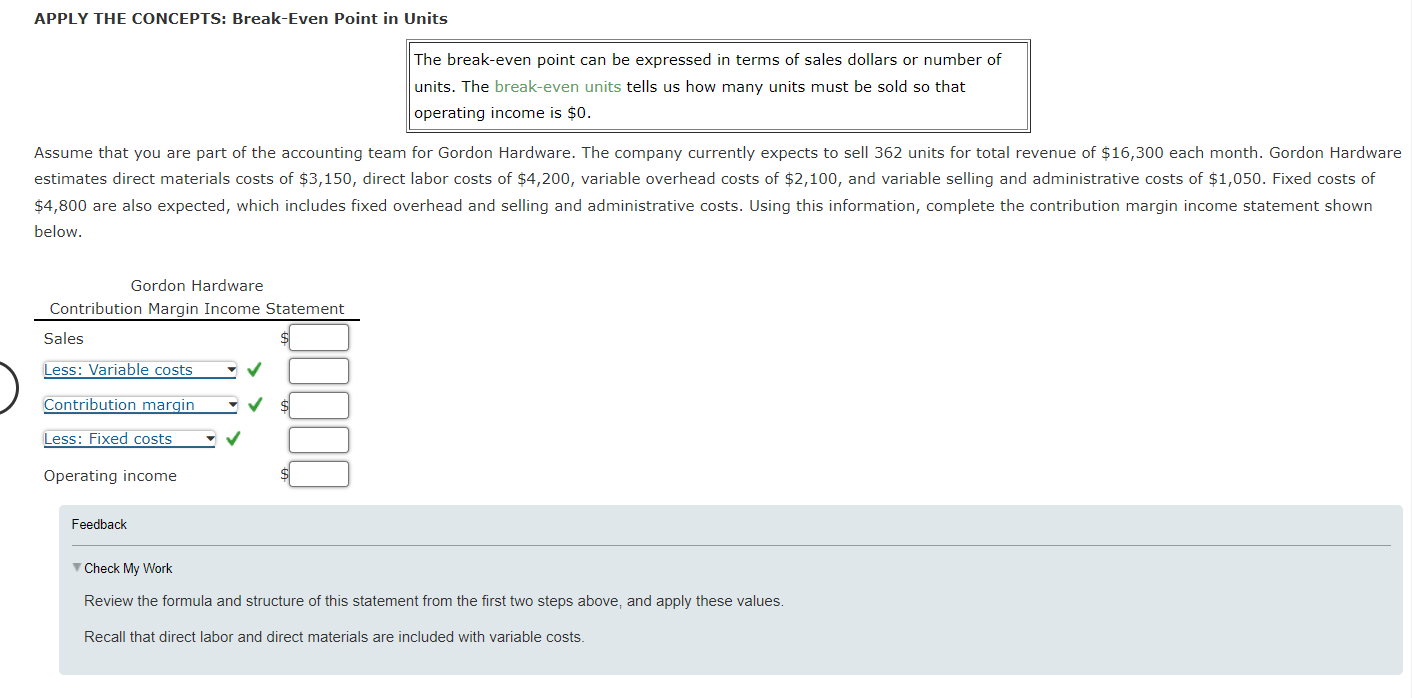
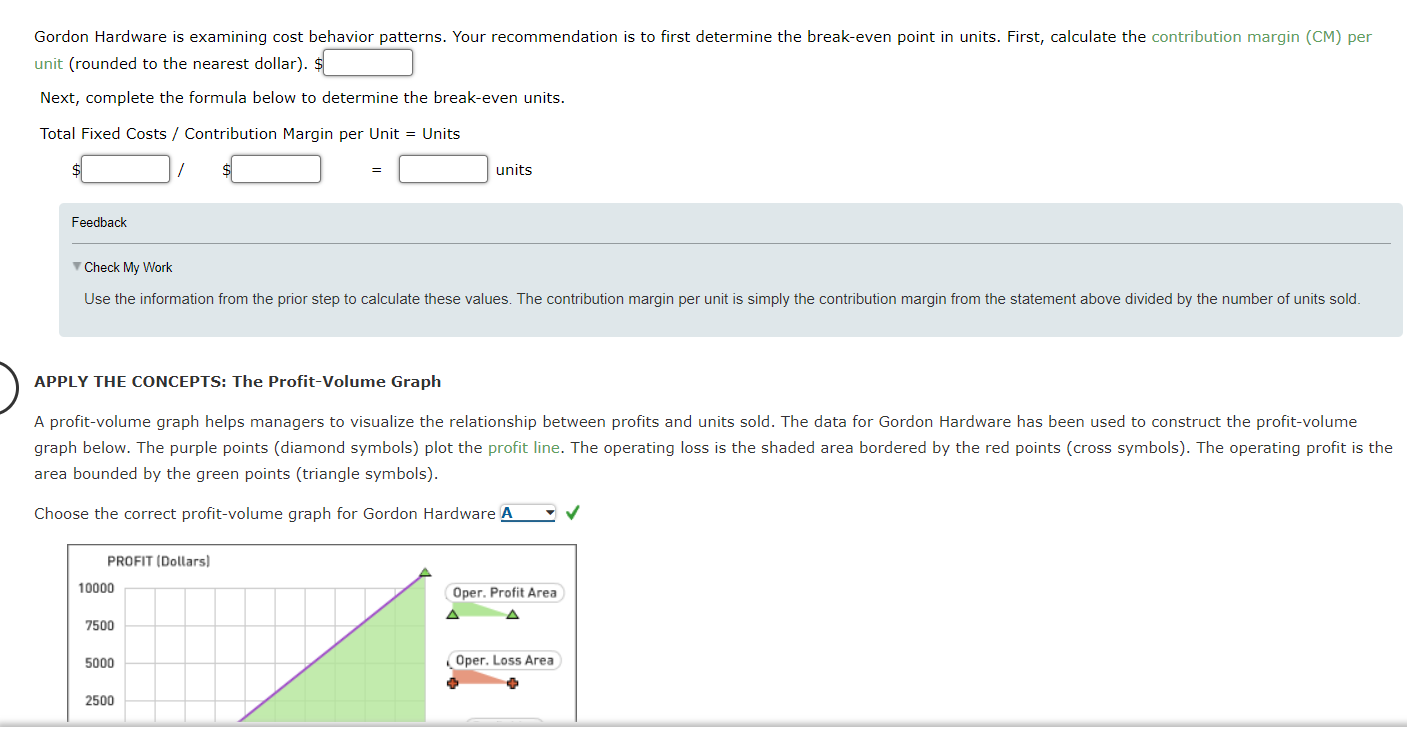
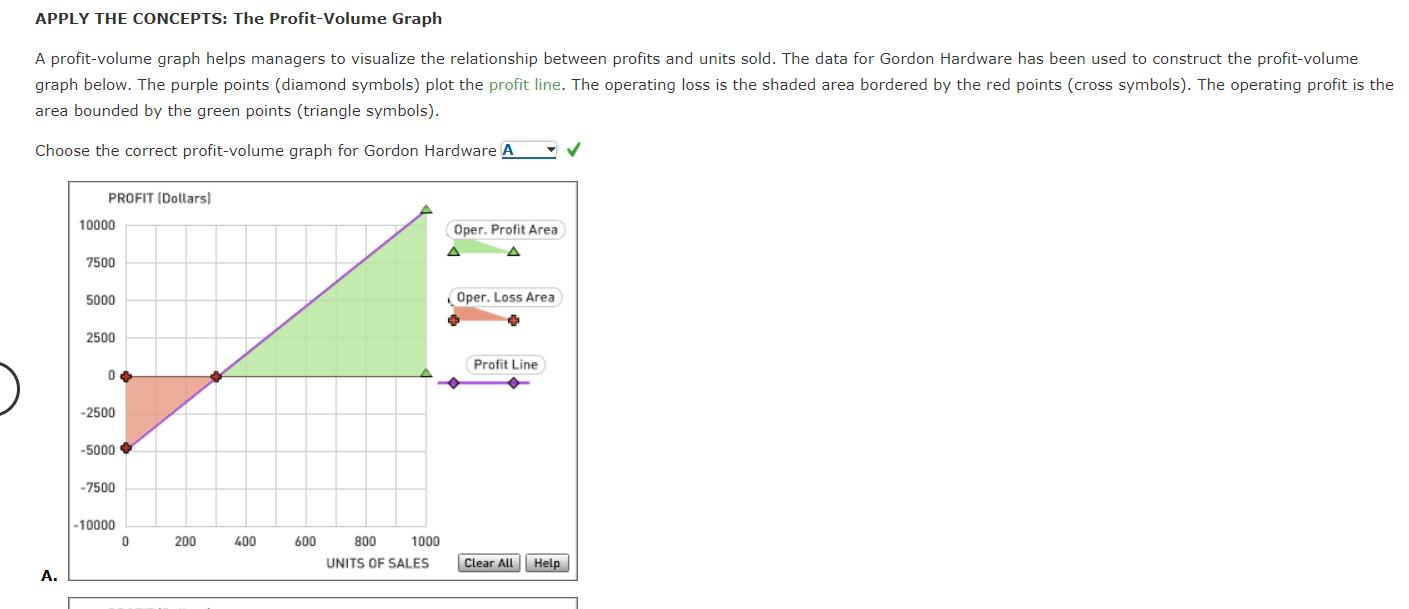
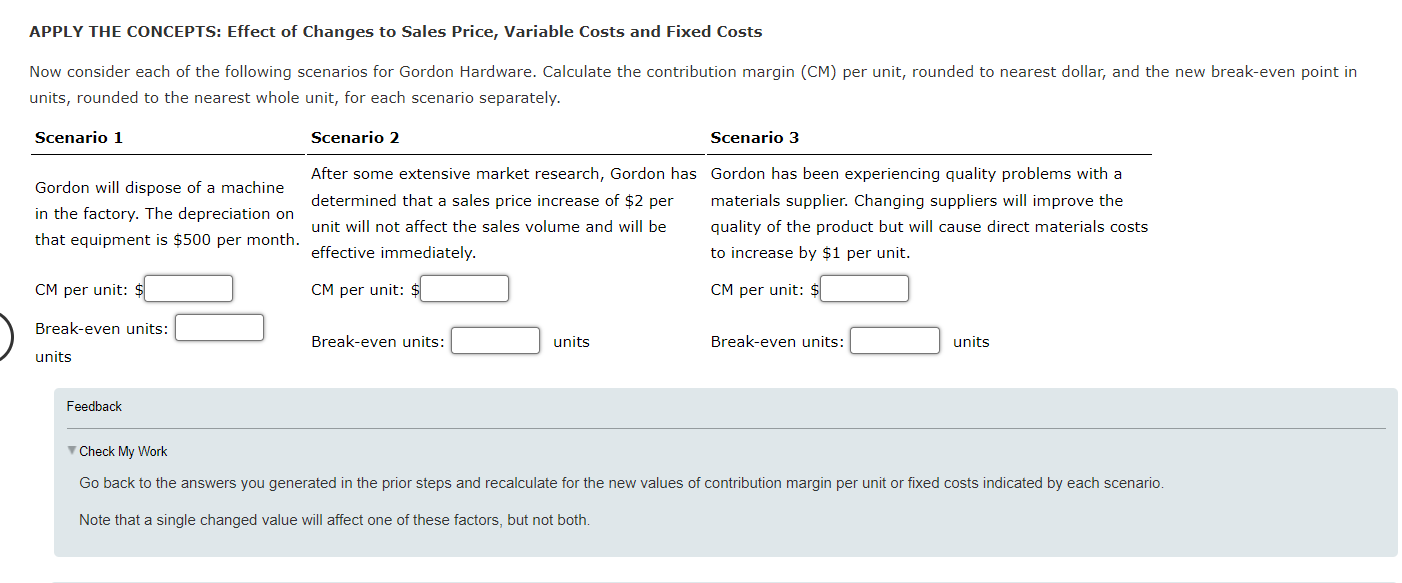
Mastery Problem: CVP and the Contribution Margin Income Statement For planning and control purposes, managers have a powerful tool known as cost-volume-profit (CVP) analysis. CVP shows how revenues, expenses, and profits behave as volume changes. In CVP analysis, costs are classified according to behavior: variable or fixed. Costs are classified by behavior on the income statement in CVP analysis to arrive at operating income. This format is known as the contribution margin income statement. Complete the following table to illustrate the format. Contribution Margin Income Statement Sales $ XXX Less: Variable costs (XXX) Contribution margin $ XXX Less: Fixed costs (XXX) $ XXX Operating income Feedback Check My Work Review the components of the Contribution Margin Income Statement and the underlined definitions above to determine their relationships in this statement. Contribution margin is calculated first. It is the difference between sales and variable costs. Contribution margin is the amount that is available to pay fixed those costs are paid, anything remaining from contribution margin becomes profit costs. After CVP and the Break-Even Point Review the following concepts about CVP analysis and break-even point and then complete the related statements. Concept It is important to understand contribution margin because it is used to determine the break-even point, which can help predict the success of a new venture or product. The CVP formula can be used to determine the break-even point. Statement At the break-even point, operating income is $0 Contribution margin is the amount available to cover fixed costs. The CVP formula At the break-even point, contribution margin can be restated to reflect this. is equal to fixed costs Managers analyze how changes in costs and selling prices will affect contribution margin and, therefore, the break-even point. An increase in selling price or a decrease in variable costs will cause contribution margin to increase, providing more than enough to cover fixed costs. Likewise, if selling price decreases or variable costs increase, contribution margin will decrease and be less than fixed costs. When contribution margin increases, the break-even point will decrease . When contribution margin decreases, the break-even point will increase If fixed costs increase, the break-even point Any changes to fixed costs will affect the amount of contribution margin needed to will increase cover fixed costs. If fixed costs decrease, the break-even point will decrease Feedback Check My Work Rework the formula above to solve for Fixed Costs: APPLY THE CONCEPTS: Break-Even Point in Units The break-even point can be expressed in terms of sales dollars or number of units. The break-even units tells us how many units must be sold so that operating income is $0. Assume that you are part of the accounting team for Gordon Hardware. The company currently expects to sell 362 units for total revenue of $16,300 each month. Gordon Hardware estimates direct materials costs of $3,150, direct labor costs of $4,200, variable overhead costs of $2,100, and variable selling and administrative costs of $1,050. Fixed costs of $4,800 are also expected, which includes fixed overhead and selling and administrative costs. Using this information, complete the contribution margin income statement shown below. Gordon Hardware Contribution Margin Income Statement Sales Less: Variable costs Contribution margin Less: Fixed costs Operating income Feedback Check My Work Review the formula and structure of this statement from the first two steps above, and apply these values. Recall that direct labor and direct materials are included with variable costs. Gordon Hardware is examining cost behavior patterns. Your recommendation is to first determine the break-even point in units. First, calculate the contribution margin (CM) per unit (rounded to the nearest dollar). $ Next, complete the formula below to determine the break-even units. Total Fixed Costs / Contribution Margin per Unit = Units Feedback units Check My Work Use the information from the prior step to calculate these values. The contribution margin per unit is simply the contribution margin from the statement above divided by the number of units sold. APPLY THE CONCEPTS: The Profit-Volume Graph A profit-volume graph helps managers to visualize the relationship between profits and units sold. The data for Gordon Hardware has been used to construct the profit-volume graph below. The purple points (diamond symbols) plot the profit line. The operating loss is the shaded area bordered by the red points (cross symbols). The operating profit is the area bounded by the green points (triangle symbols). Choose the correct profit-volume graph for Gordon Hardware A PROFIT (Dollars) 10000 7500 5000 2500 Oper. Profit Area Oper. Loss Area APPLY THE CONCEPTS: The Profit-Volume Graph A profit-volume graph helps managers to visualize the relationship between profits and units sold. The data for Gordon Hardware has been used to construct the profit-volume graph below. The purple points (diamond symbols) plot the profit line. The operating loss is the shaded area bordered by the red points (cross symbols). The operating profit is the area bounded by the green points (triangle symbols). Choose the correct profit-volume graph for Gordon Hardware A A. PROFIT (Dollars) 10000 7500 5000 2500 0 -2500 -5000 Oper. Profit Area Oper. Loss Area Profit Line -7500 -10000 0 200 400 600 800 1000 UNITS OF SALES Clear All Help APPLY THE CONCEPTS: Effect of Changes to Sales Price, Variable Costs and Fixed Costs Now consider each of the following scenarios for Gordon Hardware. Calculate the contribution margin (CM) per unit, rounded to nearest dollar, and the new break-even point in units, rounded to the nearest whole unit, for each scenario separately. Scenario 1 Gordon will dispose of a machine in the factory. The depreciation on that equipment is $500 per month. CM per unit: $ Break-even units: units Scenario 2 After some extensive market research, Gordon has determined that a sales price increase of $2 per unit will not affect the sales volume and will be effective immediately. CM per unit: $ Break-even units: units Scenario 3 Gordon has been experiencing quality problems with a materials supplier. Changing suppliers will improve the quality of the product but will cause direct materials costs to increase by $1 per unit. CM per unit: $ Break-even units: units Feedback Check My Work Go back to the answers you generated in the prior steps and recalculate for the new values of contribution margin per unit or fixed costs indicated by each scenario. Note that a single changed value will affect one of these factors, but not both.
Step by Step Solution
There are 3 Steps involved in it
Step: 1

Get Instant Access to Expert-Tailored Solutions
See step-by-step solutions with expert insights and AI powered tools for academic success
Step: 2

Step: 3

Ace Your Homework with AI
Get the answers you need in no time with our AI-driven, step-by-step assistance
Get Started


