

Answered step by step
Verified Expert Solution
Question
1 Approved Answer
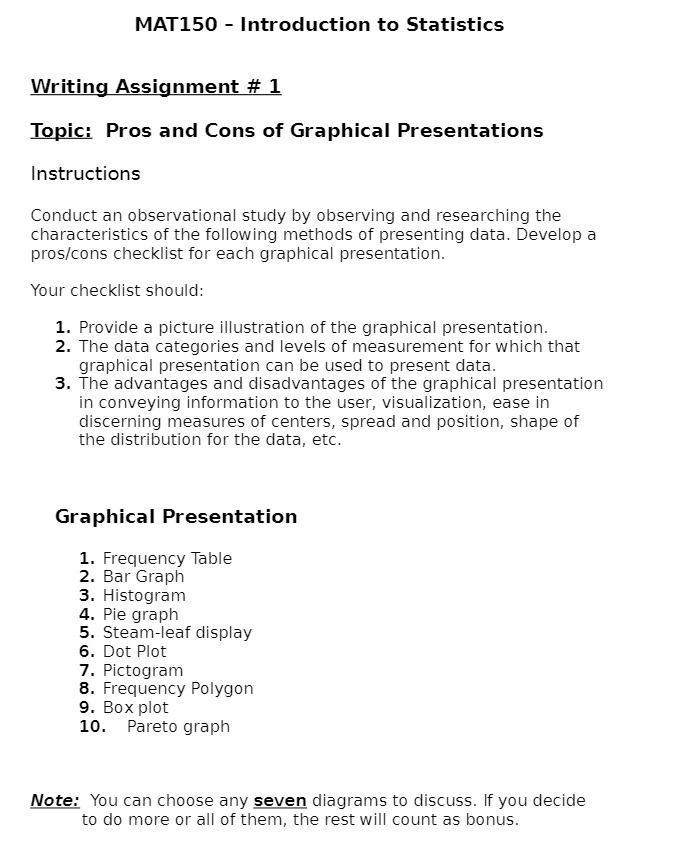
MAT150 - Introduction to Statistics Writing Assignment # 1 Topic: Pros and Cons of Graphical Presentations Instructions Conduct an observational study by observing and researching
Step by Step Solution
There are 3 Steps involved in it
Step: 1

Get Instant Access to Expert-Tailored Solutions
See step-by-step solutions with expert insights and AI powered tools for academic success
Step: 2

Step: 3
Ace Your Homework with AI
Get the answers you need in no time with our AI-driven, step-by-step assistance
Get Started
Stability Analysis Of Nonlinear Systems
Authors: Vangipuram Lakshmikantham, Srinivasa Leela, Anatoly A Martynyuk
2nd Edition
3319272004, 9783319272009