 Match the companies with the balance sheet and income statement
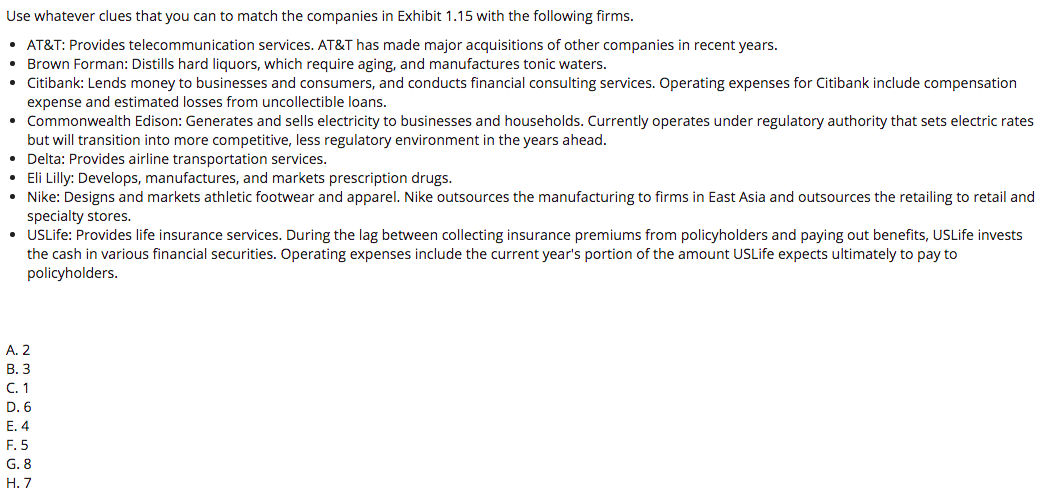
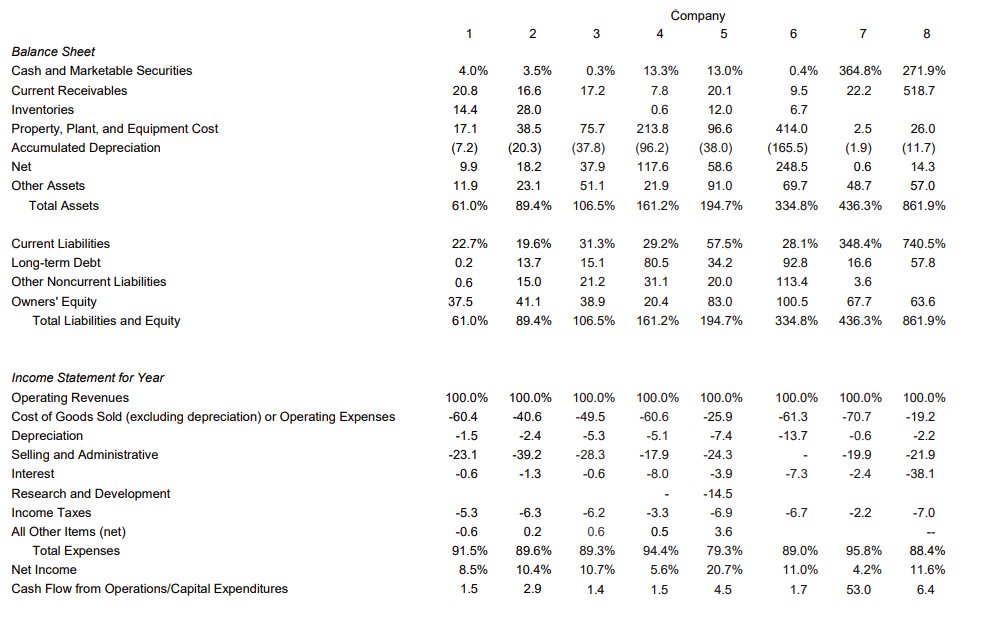
Use whatever clues that you can to match the companies in Exhibit 1.15 with the following firms. AT&T: Provides telecommunication services. AT&T has made major acquisitions of other companies in recent years. Brown Forman: Distills hard liquors, which require aging, and manufactures tonic waters. Citibank: Lends money to businesses and consumers, and conducts financial consulting services. Operating expenses for Citibank include compensation expense and estimated losses from uncollectible loans. Commonwealth Edison: Generates and sells electricity to businesses and households. Currently operates under regulatory authority that sets electric rates but will transition into more competitive, less regulatory environment in the years ahead. Delta: Provides airline transportation services. Eli Lilly: Develops, manufactures, and markets prescription drugs. Nike: Designs and markets athletic footwear and apparel. Nike outsources the manufacturing to firms in East Asia and outsources the retailing to retail and specialty stores. USLife: Provides life insurance services. During the lag between collecting insurance premiums from policyholders and paying out benefits, USLife invests the cash in various financial securities. Operating expenses include the current year's portion of the amount USLife expects ultimately to pay to policyholders. A. 2 B.3 C. 1 D. 6 E. 4 F. 5 G. 8 H. 7 Company 4 5 1 2 3 6 7 8 4.0% 3.5% 0.3% 13.3% 364.8% 22.2 0.4% 9.5 6.7 271.9% 518.7 16.6 17.2 Balance Sheet Cash and Marketable Securities Current Receivables Inventories Property, Plant, and Equipment Cost Accumulated Depreciation Net Other Assets Total Assets 414.0 20.8 14.4 17.1 (7.2) 9.9 11.9 28.0 38.5 (20.3) 18.2 23.1 89.4% 75.7 (37.8) 37.9 51.1 7.8 0.6 213.8 (96.2) 117.6 21.9 161.2% 13.0% 20.1 12.0 96.6 (38.0) 58.6 91.0 194.7% (165.5) 248.5 69.7 334.8% 2.5 (1.9) 0.6 48.7 26.0 (11.7) 14.3 57.0 861.9% 61.0% 106.5% 436.3% 22.7% 19.6% 348.4% 16.6 740.5% 57.8 0.2 13.7 Current Liabilities Long-term Debt Other Noncurrent Liabilities Owners' Equity Total Liabilities and Equity 0.6 37.5 61.0% 31.3% 15.1 21.2 38.9 106.5% 15.0 41.1 89.4% 29.2% 80.5 31.1 20.4 161.2% 28.1% 92.8 113.4 100.5 57.5% 34.2 20.0 83.0 194.7% 3.6 67.7 63.6 861.9% 334.8% 436.3% 100.0% 100.0% -60.4 -1.5 100.0% -25.9 100.0% -40.6 -2.4 -39.2 -1.3 100.0% -49.5 -5.3 -28.3 -0.6 100.0% -60.6 -5.1 -17.9 -8.0 -61.3 -13.7 100.0% -70.7 -0.6 -7.4 100.0% -19.2 -2.2 -21.9 -38.1 -23.1 -24.3 -3.9 -19.9 -2.4 -0.6 -7.3 Income Statement for Year Operating Revenues Cost of Goods Sold (excluding depreciation) or Operating Expenses Depreciation Selling and Administrative Interest Research and Development Income Taxes All Other Items (net) Total Expenses Net Income Cash Flow from Operations/Capital Expenditures -6.7 -2.2 -7.0 -5.3 -0.6 91.5% 8.5% 1.5 -6.3 0.2 89.6% 10.4% 2.9 -6.2 0.6 89.3% 10.7% % -3.3 0.5 94.4% 5.6% - 14.5 -6.9 3.6 79.3% 20.7% 89.0% 95.8% 88.4% 11.6% 11.0% 4.2% 1.4 1.5 4.5 1.7 53.0 6.4

 Match the companies with the balance sheet and income statement


