

Answered step by step
Verified Expert Solution
Question
1 Approved Answer
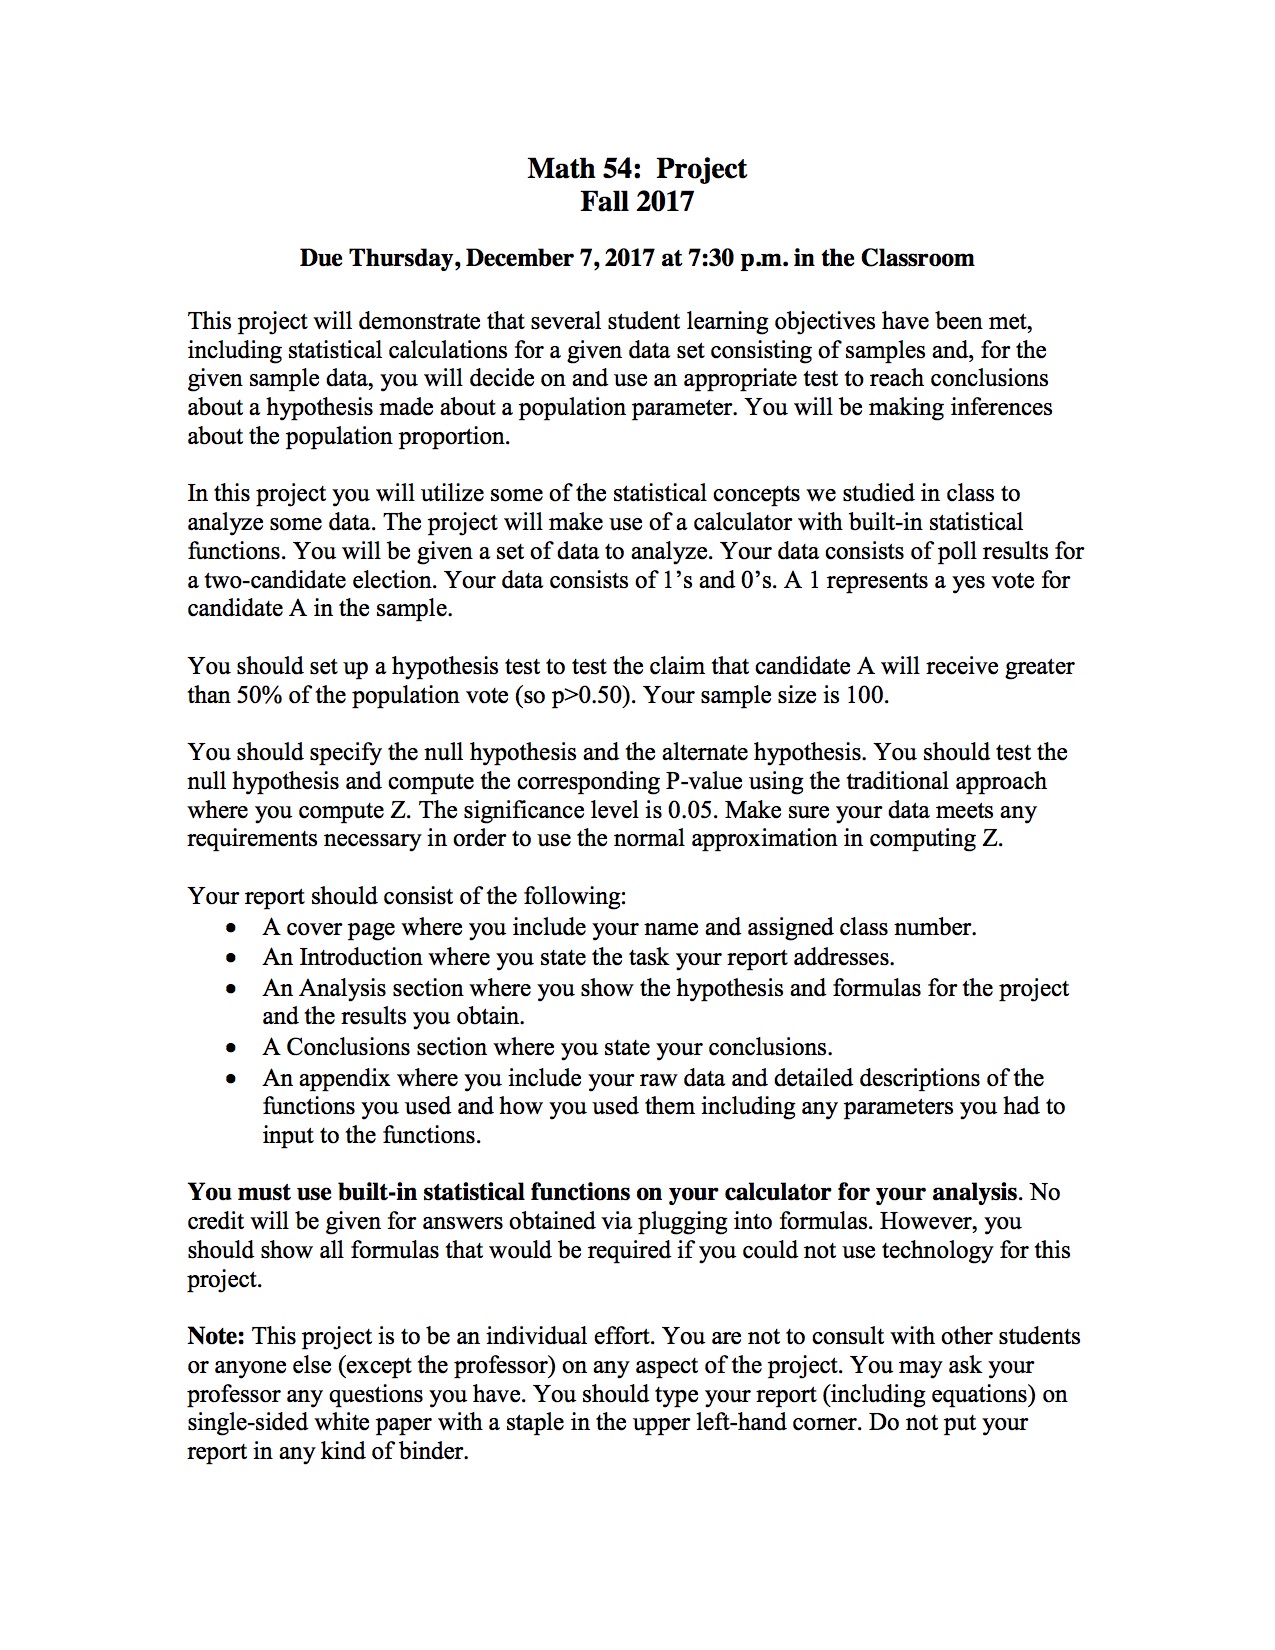
Math 54: Project Fall 2017 Due Thursday, December 7, 2017 at 7:30 pm. in the Classroom This project will demonstrate that several student learning objectives
Step by Step Solution
There are 3 Steps involved in it
Step: 1

Get Instant Access to Expert-Tailored Solutions
See step-by-step solutions with expert insights and AI powered tools for academic success
Step: 2

Step: 3
Ace Your Homework with AI
Get the answers you need in no time with our AI-driven, step-by-step assistance
Get Started
An Introduction to the Mathematics of Financial Derivatives
Authors: Ali Hirsa, Salih N. Neftci
3rd edition
012384682X, 978-0123846822