

Answered step by step
Verified Expert Solution
Question
1 Approved Answer
MATHLAB. Problem 6 : Solve the problem 2 1 of the course textbook. For the time t used in the equation, use a
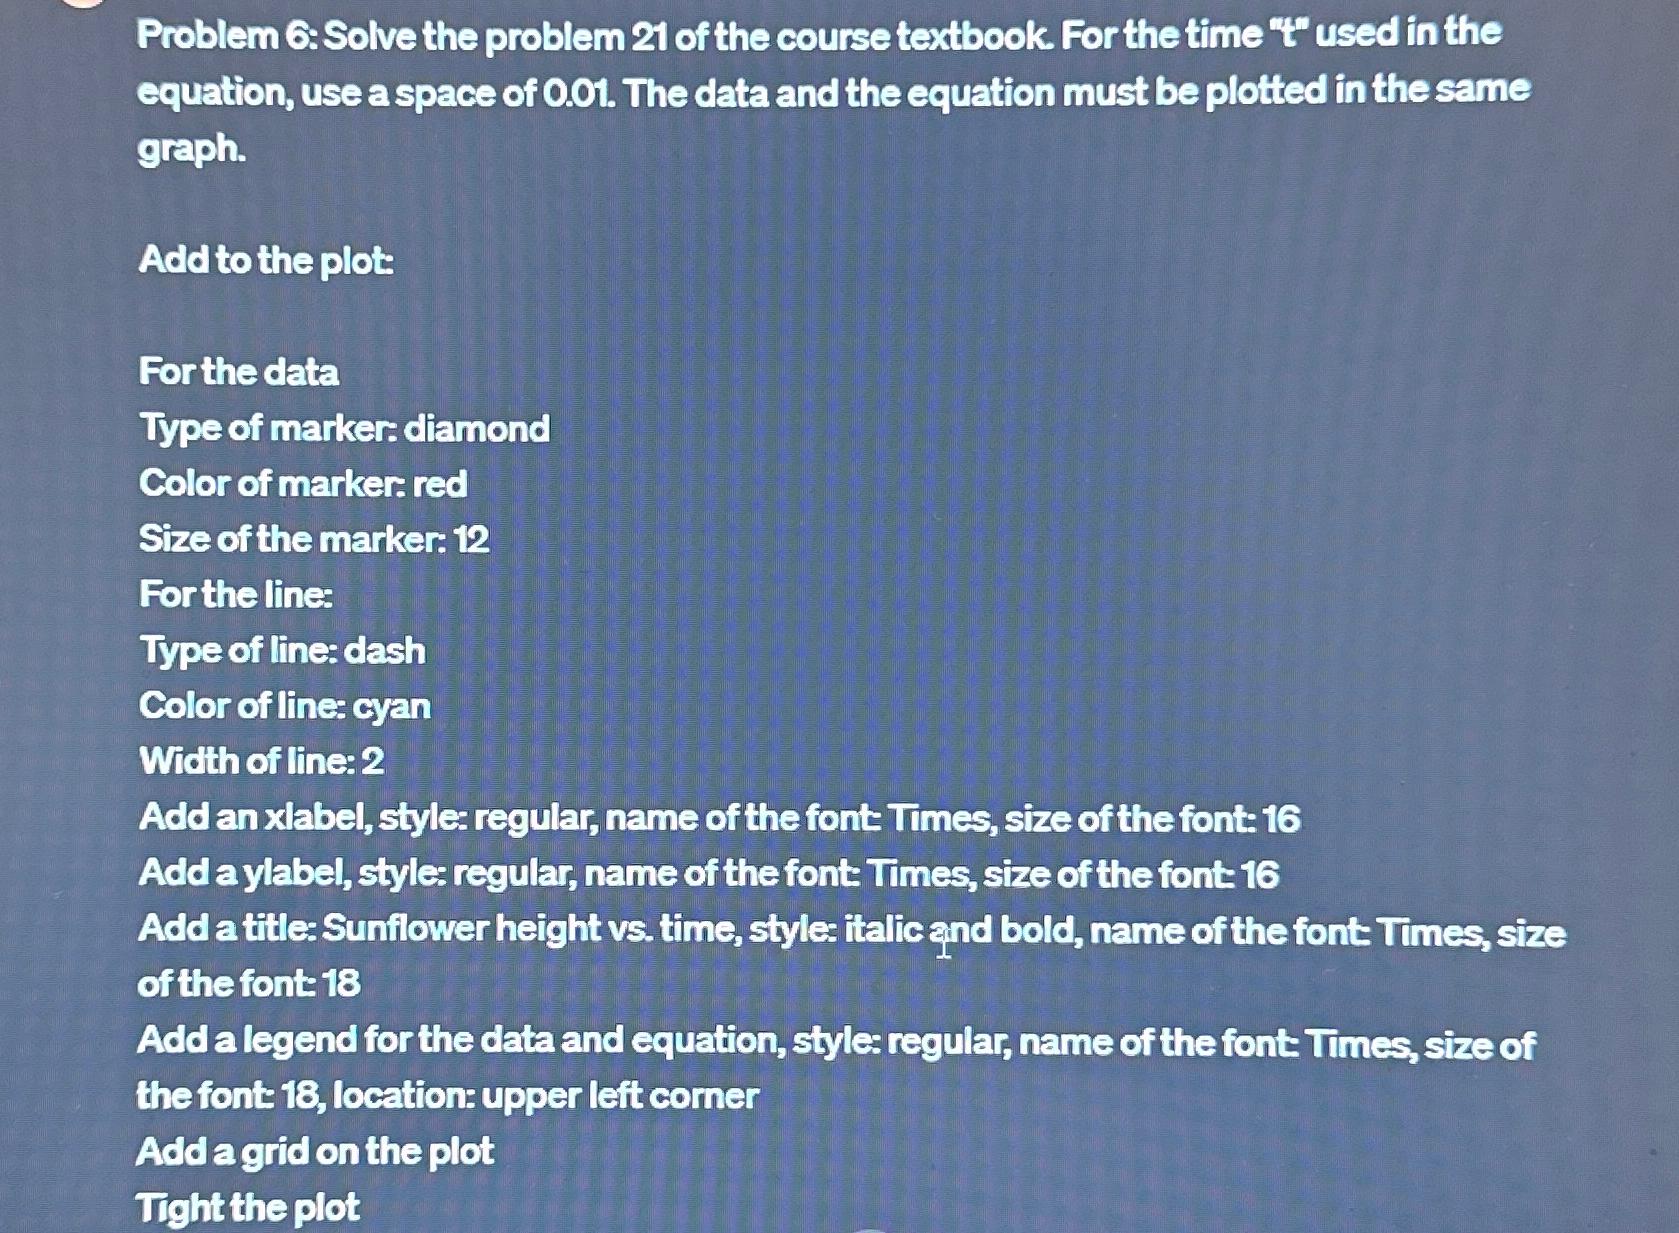
MATHLAB. Problem : Solve the problem of the course textbook. For the time t used in the equation, use a space of The data and the equation must be plotted in the same graph.
Add to the plot:
For the data
Type of marker: diamond
Color of marker: red
Size of the marker:
For the line:
Type of line: dash
Color of line: cyan
Width of line:
Add an xlabel, style: regular, name of the font Times, size of the font:
Add a ylabel, style: regular, name of the font: Times, size of the font:
Add a title: Sunflower height ve time, style: italicand bold, name of the font Times, size of the font:
Add a legend for the data and equation, style:regular, name of the font Times, size of the font location: upper left corner
Add a grid on the plot
Tight the plot
Step by Step Solution
There are 3 Steps involved in it
Step: 1

Get Instant Access to Expert-Tailored Solutions
See step-by-step solutions with expert insights and AI powered tools for academic success
Step: 2

Step: 3
Ace Your Homework with AI
Get the answers you need in no time with our AI-driven, step-by-step assistance
Get Started
Mastering Real Time Analytics In Big Data A Comprehensive Guide For Everyone
Authors: Lennox Mark
1st Edition
B0CPTC9LY9, 979-8869045706