Answered step by step
Verified Expert Solution
Link Copied!

Question

1 Approved Answer

[MATLAB], [C++], or [JAVA] languages can be used ----------------------------------------------- A packet train of length i is a sequence of i consecutive packets (with no gaps

[MATLAB], [C++], or [JAVA] languages can be used

-----------------------------------------------
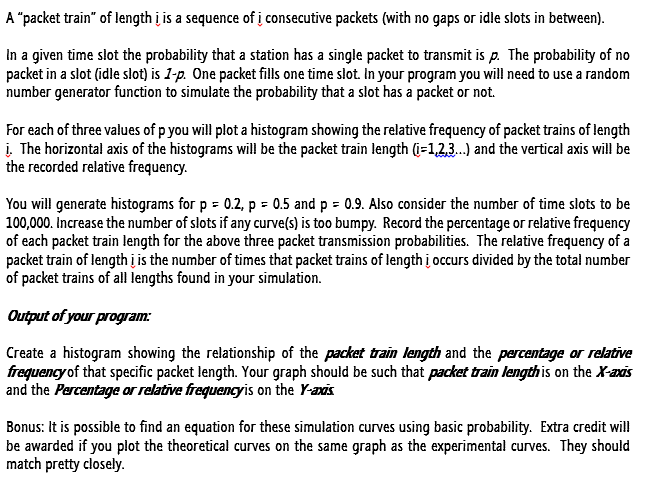
image text in transcribed

A "packet train" of length i is a sequence of i consecutive packets (with no gaps or idle slots in between). In a given time slot the probability that a station has a single packet to transmit is p. The probability of no packet in a slot (idle slot) is 1-p. One packet fills one time slot In your program you will need to use a random number generator function to simulate the probability that a slot has a packet or not. For each of three values of p you will plot a histogram showing the relative frequency of packet trains of length i. The horizontal axis of the histograms will be the packet train length (i = 1, 2, 3...) and the vertical axis will be the recorded relative frequency. You will generate histograms for p = 0.2, p = 0.5 and p = 0.9. Also consider the number of time slots to be 100,000. Increase the number of slots if any curve(s) is too bumpy. Record the percentage or relative frequency of each packet train length for the above three packet transmission probabilities. The relative frequency of a packet train of length i is the number of times that packet trains of length i occurs divided by the total number of packet trains of all lengths found in your simulation. Output of your program: Create a histogram showing the relationship of the packet train length and the percentage or relative frequency that specific packet length. Your graph should be such that packet train length is on the X-axis and the Percentage or relative frequency is on the Y-axis. It is possible to find an equation for these simulation curves using basic probability. Extra credit will be awarded if you plot the theoretical curves on the same graph as the experimental curves. They should match pretty closely

Step by Step Solution

There are 3 Steps involved in it

Step: 1

blur-text-image

Get Instant Access to Expert-Tailored Solutions

See step-by-step solutions with expert insights and AI powered tools for academic success

Step: 2

blur-text-image

Step: 3

blur-text-image

Ace Your Homework with AI

Get the answers you need in no time with our AI-driven, step-by-step assistance

Get Started

Recommended Textbook for

Oracle Database 19c DBA By Examples Installation And Administration

Authors: Ravinder Gupta

1st Edition

B09FC7TQJ6, 979-8469226970

More Books

Students also viewed these Databases questions

Question

Different formulas for mathematical core areas.

Answered: 1 week ago