

Answered step by step
Verified Expert Solution
Question
1 Approved Answer
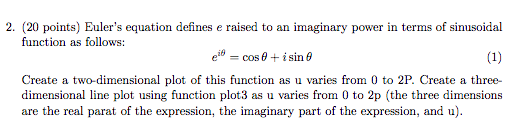
Matlab: Create a 2-D plot of this function as u varies from 0 to 2pi. Create a 3-D line plot using function plot3 as u
Matlab: Create a 2-D plot of this function as u varies from 0 to 2pi. Create a 3-D line plot using function plot3 as u varies from 0 to 2pi.
Step by Step Solution
There are 3 Steps involved in it
Step: 1

Get Instant Access to Expert-Tailored Solutions
See step-by-step solutions with expert insights and AI powered tools for academic success
Step: 2

Step: 3
Ace Your Homework with AI
Get the answers you need in no time with our AI-driven, step-by-step assistance
Get Started
OCA Oracle Database SQL Exam Guide Exam 1Z0-071
Authors: Steve O'Hearn
1st Edition
1259585492, 978-1259585494