

Answered step by step
Verified Expert Solution
Question
1 Approved Answer
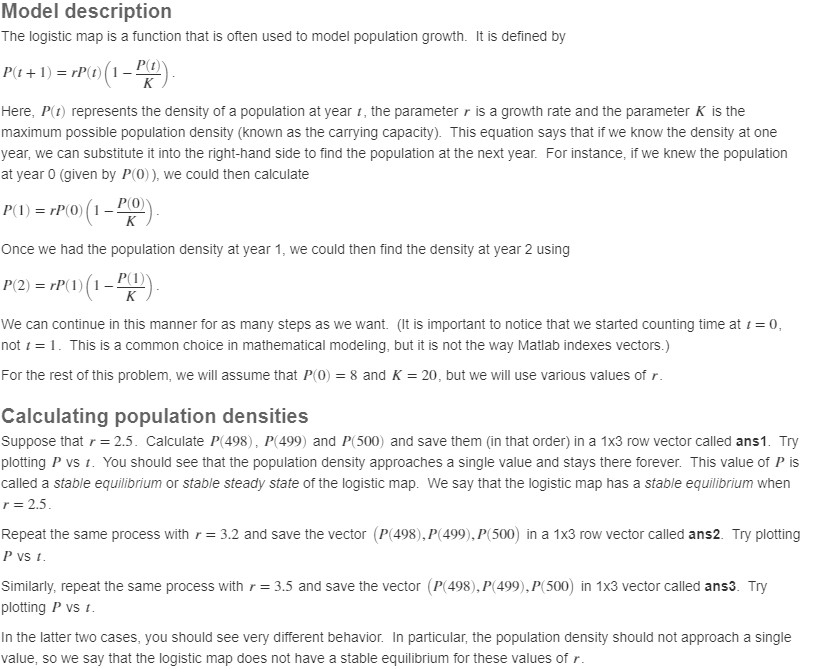
MATLAB MATLAB MATLAB Model description The logistic map is a function that is often used to model population growth. It is defined by P(t+1) =
MATLAB MATLAB MATLAB
Model description The logistic map is a function that is often used to model population growth. It is defined by P(t+1) = rP Here, P(1) represents the density of a population at year 1, the parameter r is a growth rate and the parameter K is the maximum possible population density (known as the carrying capacity). This equation says that if we know the density at one year, we can substitute it into the right-hand side to find the population at the next year. For instance, if we knew the population at year 0 (given by PO), we could then calculate P(1) = rPCO (1-P) Once we had the population density at year 1, we could then find the density at year 2 using P(2) = rP(1)(1-??). We can continue in this manner for as many steps as we want. (It is important to notice that we started counting time at 1 = 0, not t = 1. This is a common choice in mathematical modeling, but it is not the way Matlab indexes vectors.) For the rest of this problem, we will assume that P(0) = 8 and K = 20, but we will use various values of r. Calculating population densities Suppose that r = 2.5. Calculate P(498), P(499) and P(500) and save them in that order) in a 1x3 row vector called ans1. Try plotting P VS I. You should see that the population density approaches a single value and stays there forever. This value of P is called a stable equilibrium or stable steady state of the logistic map. We say that the logistic map has a stable equilibrium when r=2.5. Repeat the same process with r = 3.2 and save the vector P(498), P (499), P(500) in a 1x3 row vector called ans2. Try plotting P VS 1. Similarly, repeat the same process with r= 3.5 and save the vector P(498), P 499),P(500) in 1x3 vector called ans3. Try plotting P VS I. In the latter two cases, you should see very different behavior. In particular, the population density should not approach a single value, so we say that the logistic map does not have a stable equilibrium for these values of rStep by Step Solution
There are 3 Steps involved in it
Step: 1

Get Instant Access to Expert-Tailored Solutions
See step-by-step solutions with expert insights and AI powered tools for academic success
Step: 2

Step: 3
Ace Your Homework with AI
Get the answers you need in no time with our AI-driven, step-by-step assistance
Get Started
Database Support For Data Mining Applications Discovering Knowledge With Inductive Queries Lnai 2682
Authors: Rosa Meo ,Pier L. Lanzi ,Mika Klemettinen
2004th Edition
3540224793, 978-3540224792