Answered step by step
Verified Expert Solution
Question
1 Approved Answer
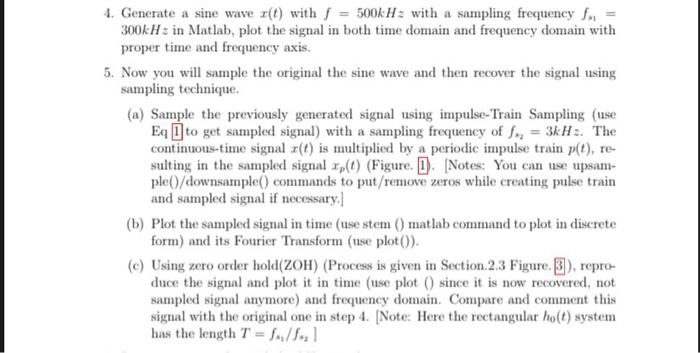
matlab q4,5 4. Generate a sine wave x(t) with f=500kHz with a sampling frequency fs1= 300kHz in Matlab, plot the signal in both time domain
matlab
4. Generate a sine wave x(t) with f=500kHz with a sampling frequency fs1= 300kHz in Matlab, plot the signal in both time domain and frequency domain with proper time and frequency axis. 5. Now you will sample the original the sine wave and then recover the signal using sampling technique. (a) Sample the previously generated signal using impulse-Train Sampling (use Eq 1 to get sampled signal) with a sampling frequency of fz2=3kHz. The continuous-time signal x(t) is multiplied by a periodic impulse train p(t), resulting in the sampled signal xp(t) (Figure. 1 . [Notes: You can use upsample()/downsample() commands to put/remove zeros while creating pulse train and sampled signal if necessary.] (b) Plot the sampled signal in time (use stem () matlab command to plot in discrete form) and its Fourier Transform (use plot () ). (c) Using zero order hold(ZOH) (Process is given in Section.2.3 Figure. 3 ), reproduce the signal and plot it in time (use plot () since it is now recovered, not sampled signal anymore) and frequency domain. Compare and comment this signal with the original one in step 4. [Note: Here the rectangular h0(t) system has the length T=f1/f2] q4,5 

Step by Step Solution
There are 3 Steps involved in it
Step: 1

Get Instant Access to Expert-Tailored Solutions
See step-by-step solutions with expert insights and AI powered tools for academic success
Step: 2

Step: 3

Ace Your Homework with AI
Get the answers you need in no time with our AI-driven, step-by-step assistance
Get Started


